
APPENDIX B: Internal Scan
This document highlights some of the most salient findings of the Internal Scan. Source is SMCCCD Data Warehouse unless it’s indicated otherwise.
College of San Mateo (CSM) Student Demographics
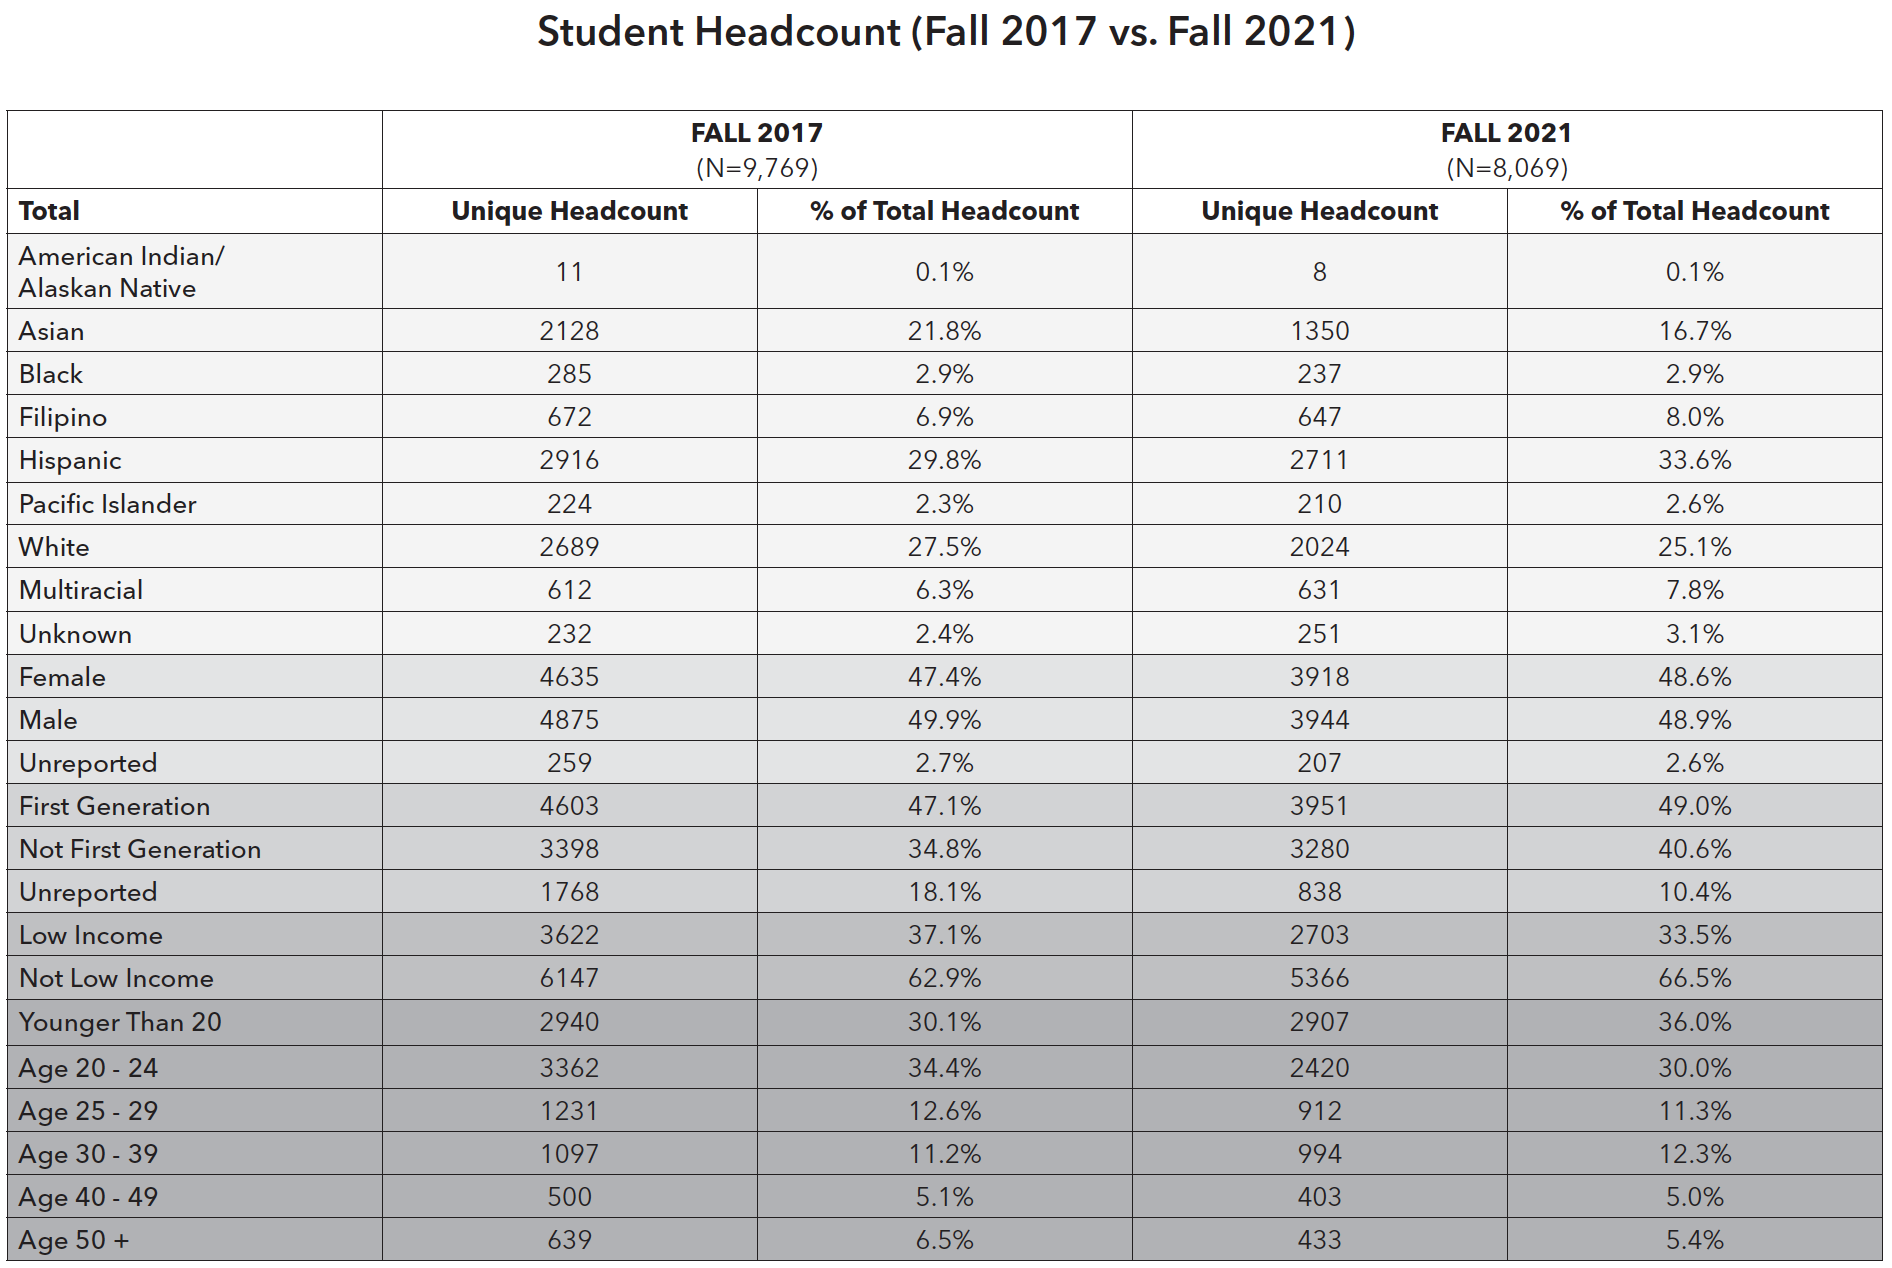
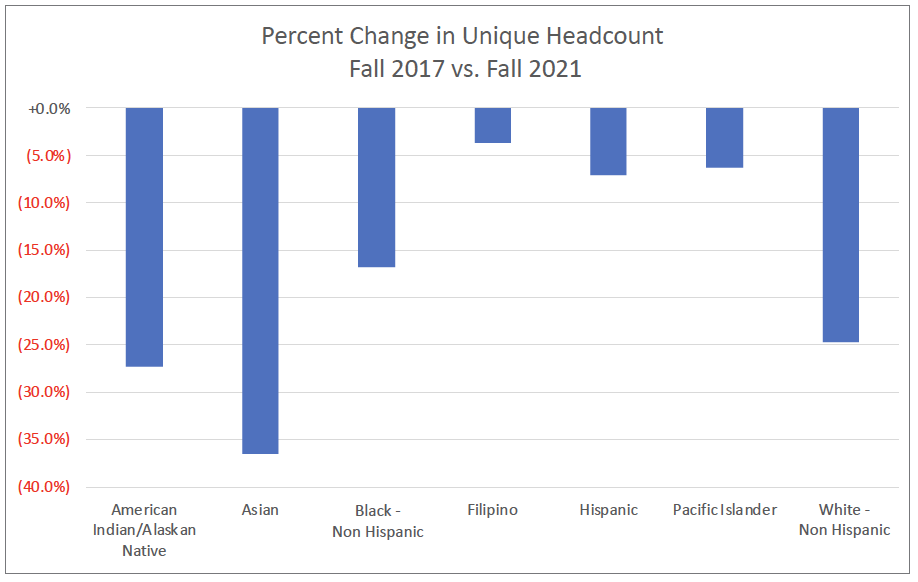
The largest student group at CSM, Latino/a/x students comprised 34% of the student body as of Fall 2021, followed by White (25%), Asian (17%), and Black/Non-Hispanic (3%) students. There has been a significant decrease by 68% in the enrollment of international students in the recent years: 250 students in Fall 2021 compared to 783 students in Fall 2017, due to the COVID-19 pandemic. The percentage of Latino/a/x students has consistently increased from 30% to 34% between Fall 2017 and Fall 2021. In Fall 2021, two-thirds of students at CSM were under 25 years old, with the largest category being students younger than 20 years old (36%), followed by students 20-24 years old (30%).
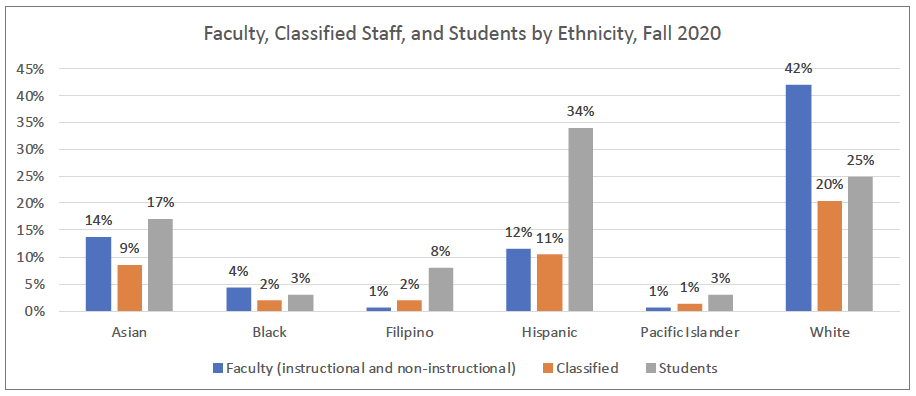
Although CSM serves a diverse student body, 64% of which is non-White with over half comprised of Latino/a/x students, the ethnicity of faculty and staff do not mirror that of the students.
Enrollment
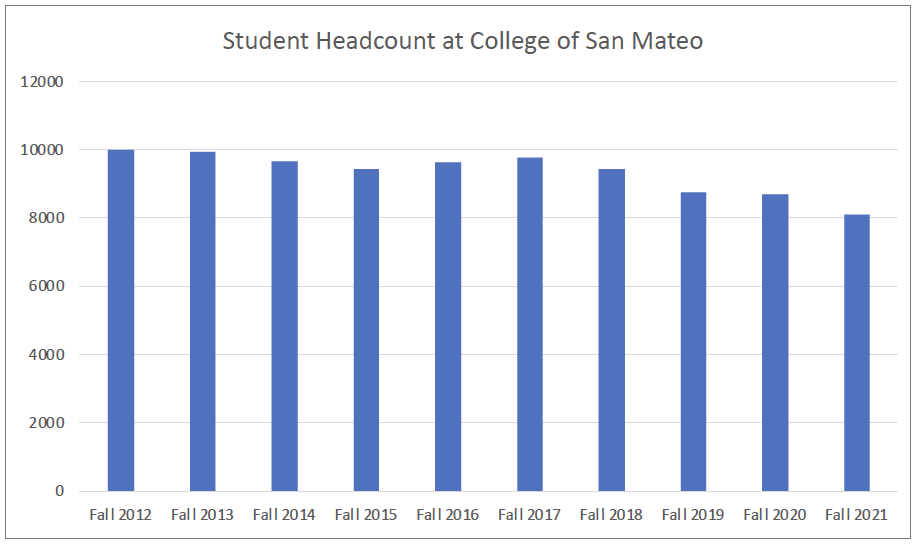
Enrollment decline has been a serious concern for California community colleges. In recent years, enrollment at CSM has steadily declined, in part exacerbated by the COVID-19 pandemic. Most noticeable is the decline in Full Time Equivalent Students (FTES), possibly due to students taking fewer units, on average, during the pandemic.
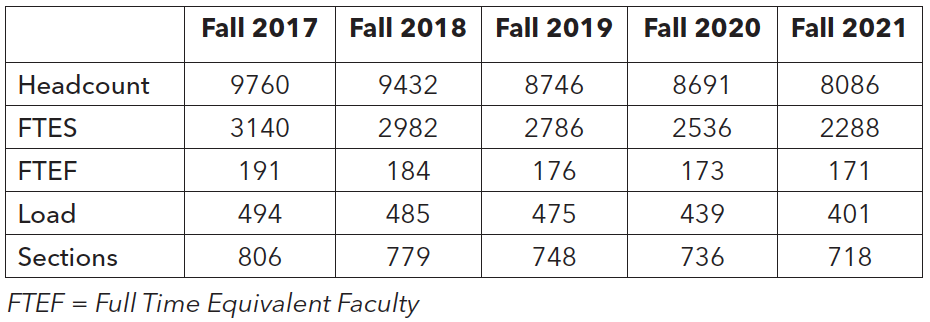
Student retention remains a concern for CSM as does bringing back students who may have stopped out during the pandemic.
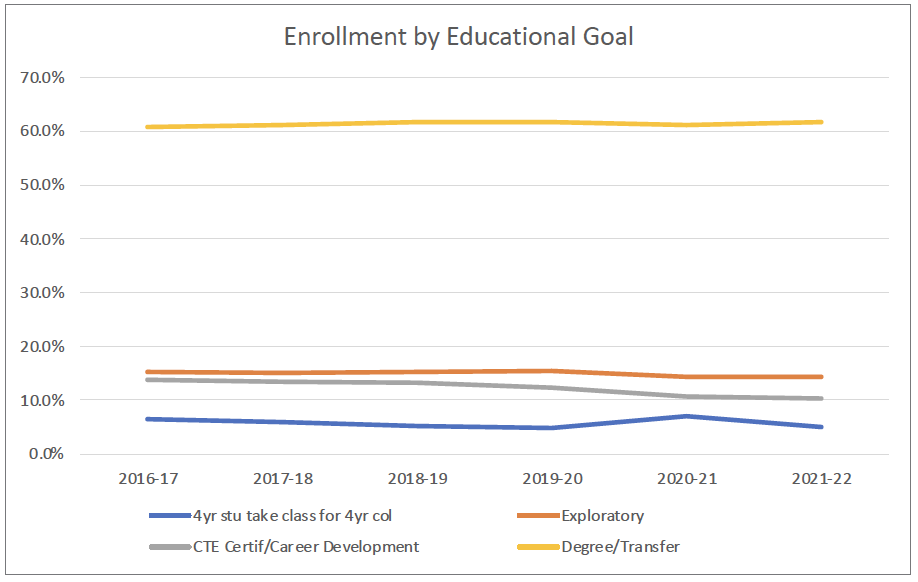
Approximately 60% of CSM students have the educational goal of attaining degrees and certificates or transferring to a four-year institution. Although providing affordable postsecondary education as a pathway to a four-year degree has been a primary goal of community colleges, it is important to remember that CSM also serves a significant percentage of non-degree seeking students with various educational goals including skill building and lifelong learning.
Nearly 60% of students who attend CSM are part-time students, defined as those who take more than 6 units and less than 12 units. In recent years, enrollment of part-time students has declined. This is important to keep in mind when designing programs and services targeting part-time students (e.g., working adults) with responsibilities outside school.

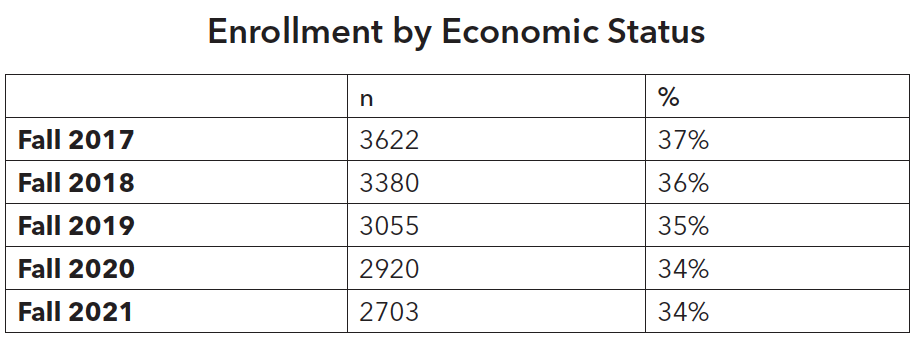
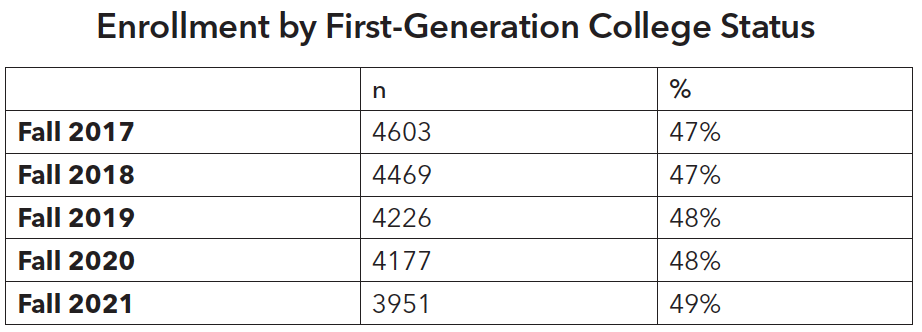
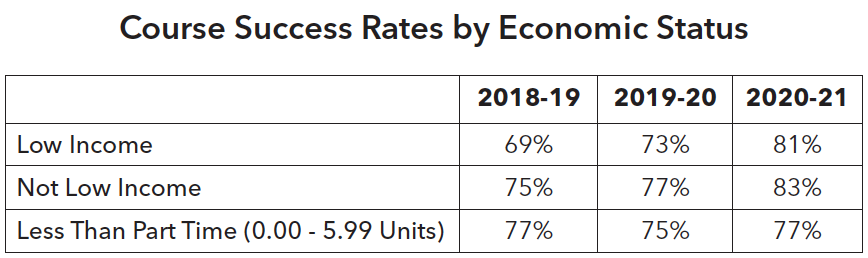
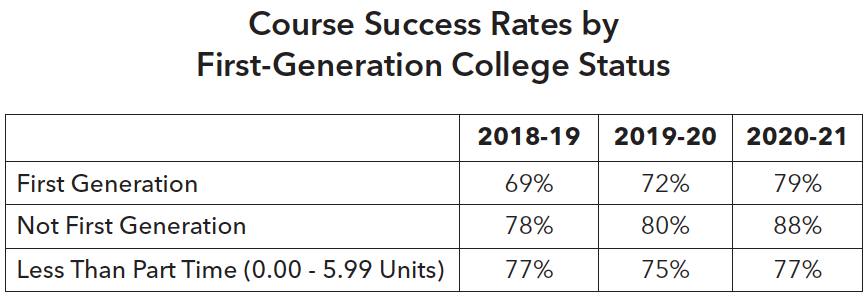
Enrollment of low-income students has decreased gradually over the years whereas enrollment of first-generation college students has slightly increased.
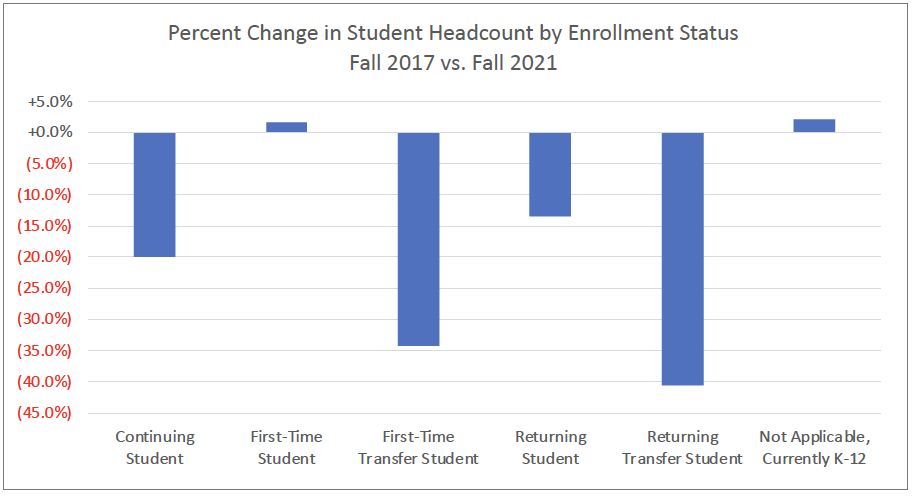
Enrollment increased for first-time students and K-12 students in Fall 2021, compared to Fall 2017. Dual Enrollment courses rose, from 14 in 2020-21 to 20 in 2021-22, with a total course enrollment increase from 257 to 562.
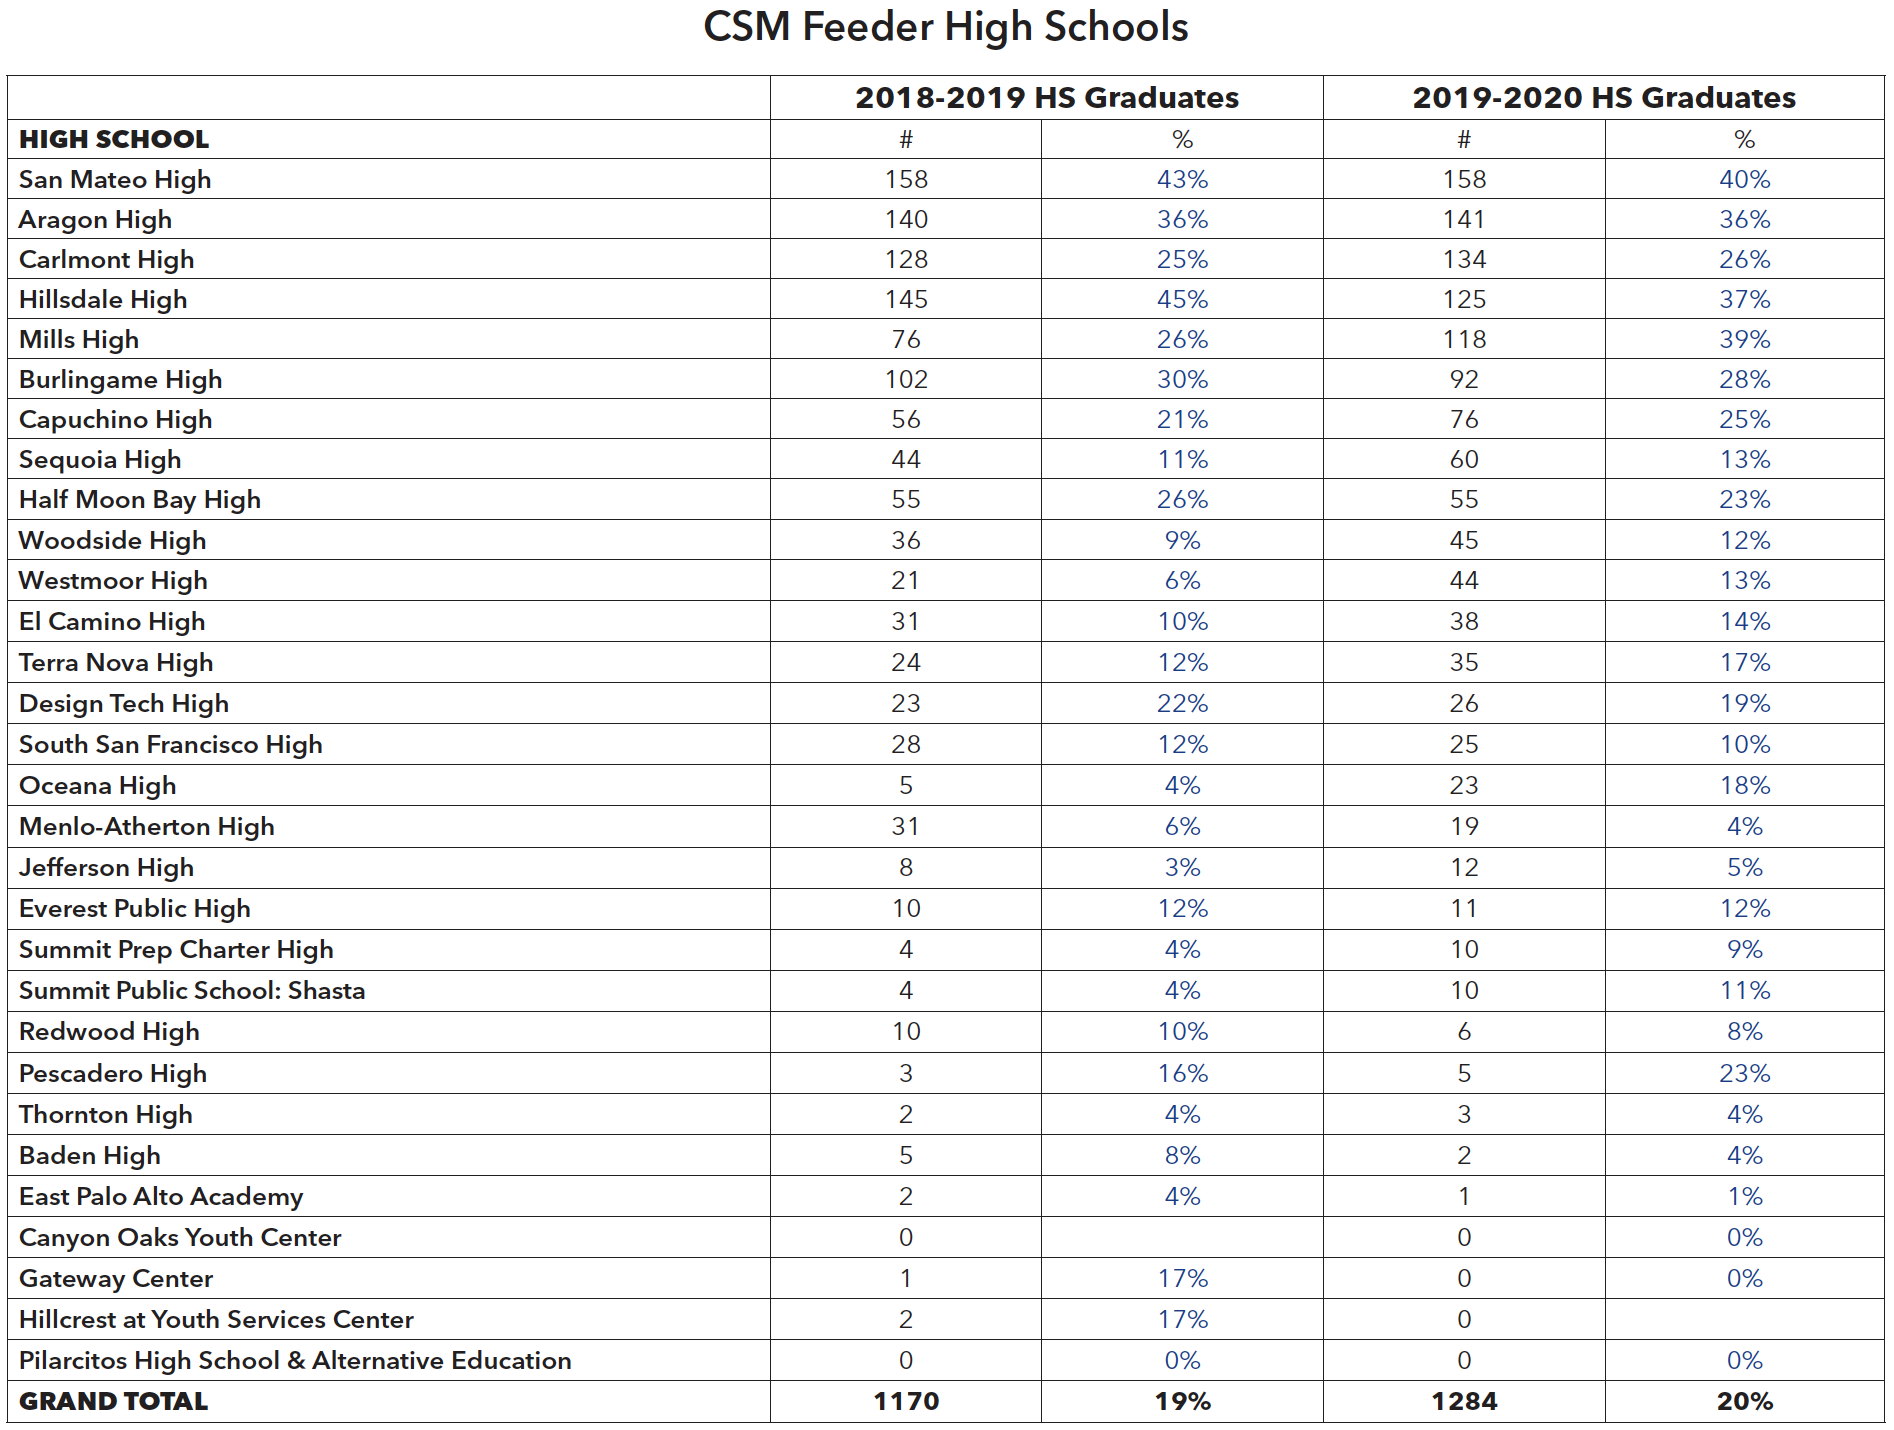
The overall percentage of high school graduates who attend CSM in 2019-20 and 2020-21 was 19% and 20%, respectively. While the list of top ten feeder high schools to CSM remains stable over the years, the take rate for Mills High significantly increased from 26% to 40% and Pescadero High from 16% to 23% from 2018-19 to 2019-20. The take rate for Hillsdale High decreased from 45% to 37% from 2018-19 to 2019-20.
Course Success Rates
At CSM, course success rates have been relatively consistent for most ethnicity groups from 2016-17 to 2020-21. In 2020-21, White and Asian groups had the highest course success rates, ranging between 79% and 82%. Course success rates for Black Non-Hispanic students slightly decreased over the past five years from 69% to 65%, remaining the lowest of any student group along with Pacific Islander students (65%), followed by Latino/a/x students (68%). Overall, Black, Indigenous & People of Color (BIPOC) students continue to experience a persistent equity gap.
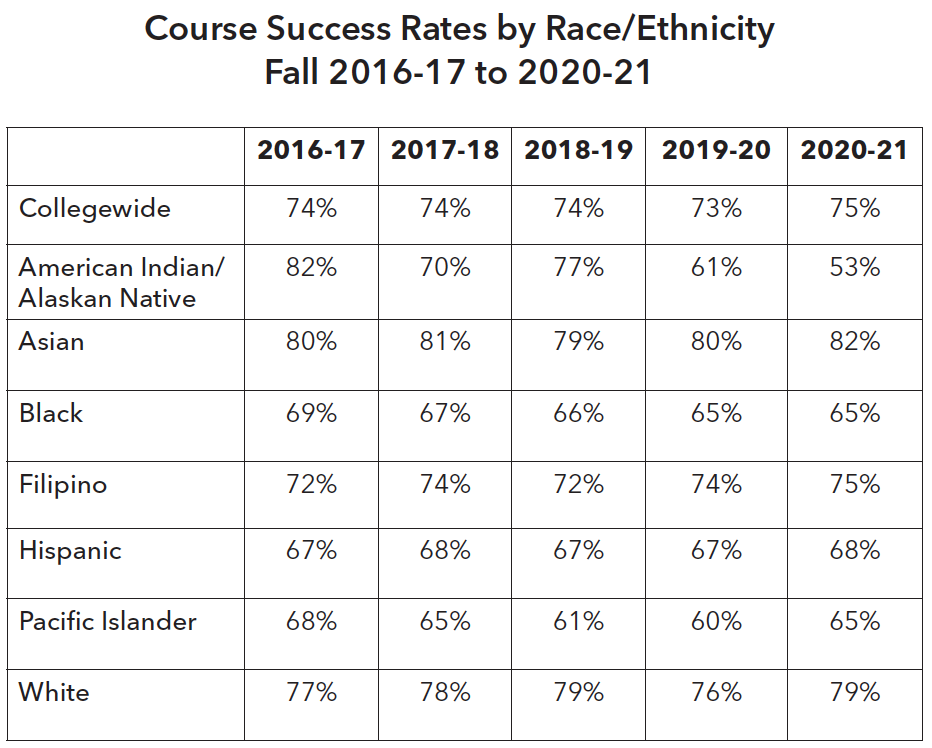
In interpreting course success rates for 2020-21, it is important to consider the impact of excused withdrawal (EW). An EW is not counted as an enrollment attempt, which allows the withdrawal not to factor in academic probation or dismissal calculations, the permitted number of withdraws, or course repeatability. Of CSM’s Spring 2020 grades issued, EWs made up 10%, compared to just 0.2% of Spring 2019 grades, which led to significantly inflated course success rates starting March 2020. Caution is advised when comparing course success rates from 2020-21 with the previous years’ data.
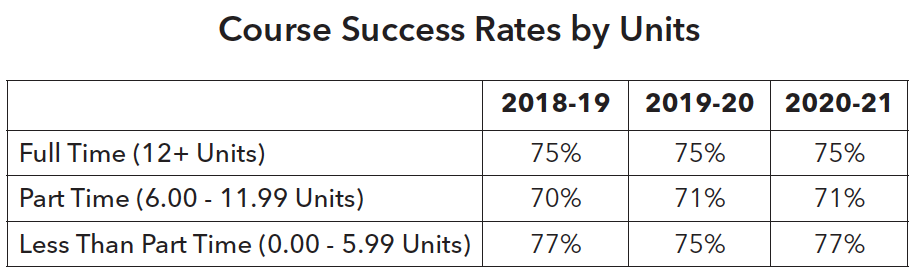
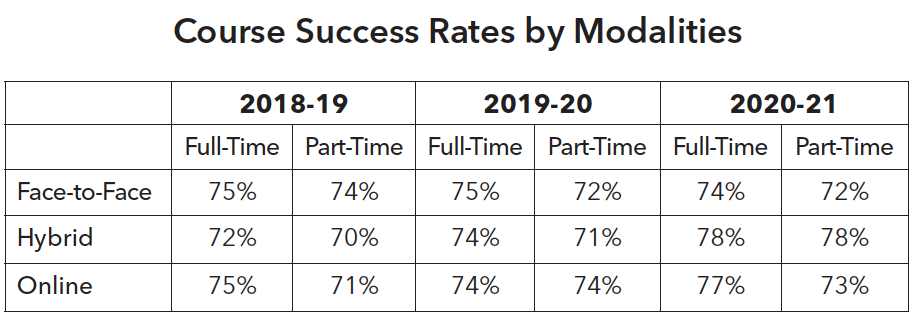
It is encouraging to see that part-time and full-time students are equally successful. Course success rates for low-income and first-generation students are consistently lower than their counterparts. Although preliminary, the hybrid learning modality yielded the highest course success rates for part-time students at 78%, compared to 72% for face-to-face learning and 73% for online learning.
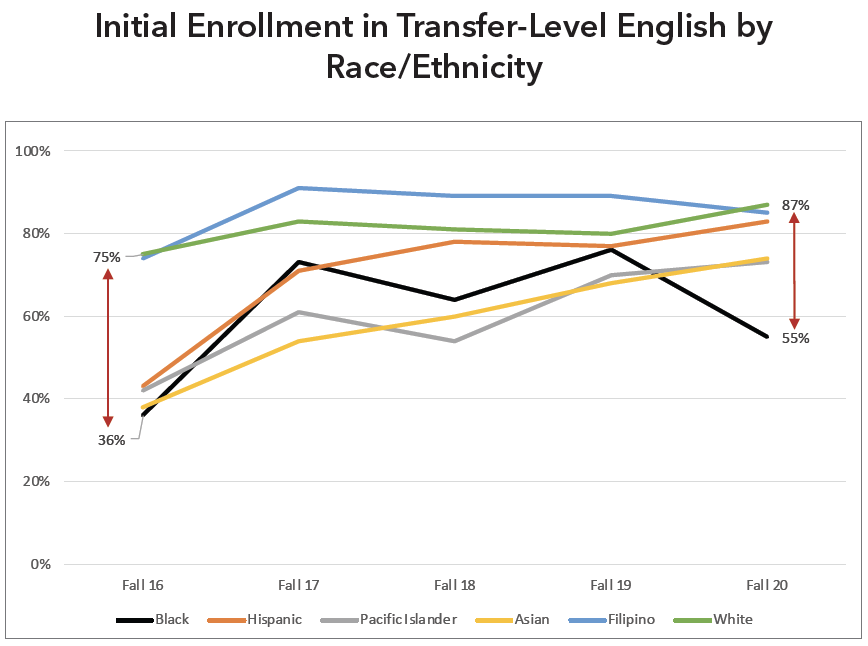
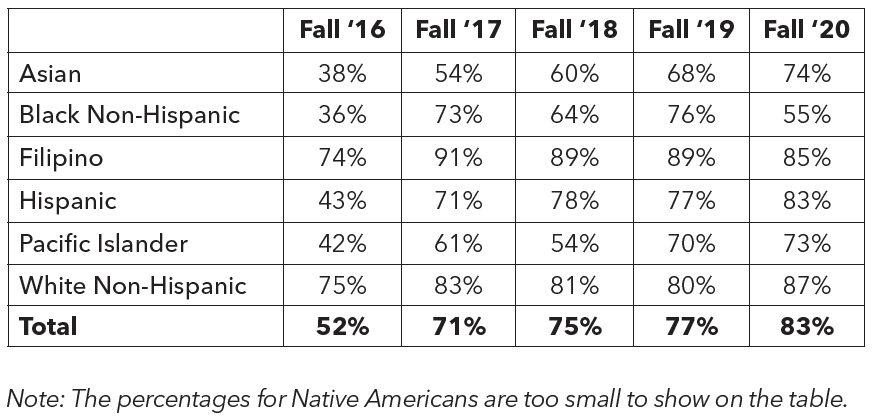
AB 705: Transfer-Level English & Math Access
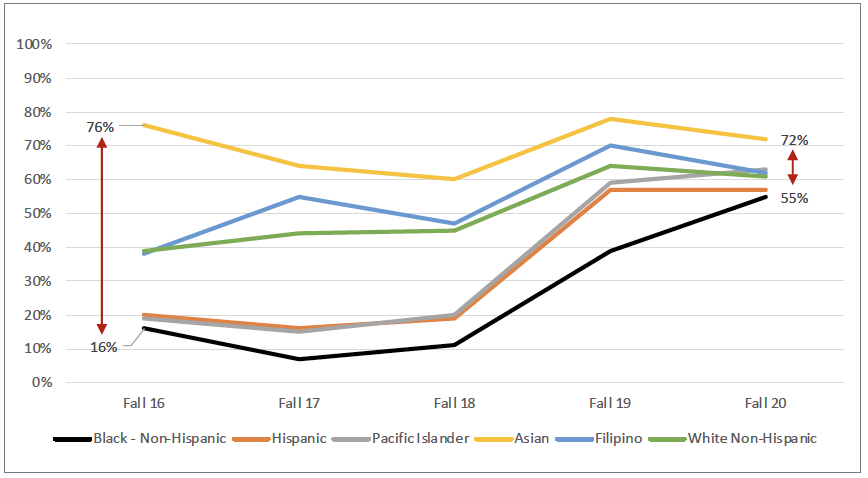
AB 705 is associated with increased access to transfer-level English and math for first-time, degree- and transfer-seeking students. Enrollments in transfer-level English jumped to 83% in Fall 2020 from 52% in Fall 2016. Similarly, enrollments in transfer-level math jumped to 62% in Fall 2020 from 42% in Fall 2016. However, for math, it is important to point out that the number of enrolled Asian students has significantly decreased over the years, which might have been affected by the enrollment decrease of international students. While the percentage of initial enrollment has gone up for both English and math since Fall 2016, it is still too early to say with certainty how AB 705 will impact future success rates.
Initial Enrollment in Transfer-Level Math by
Race/Ethnicity
AB 705: Transfer-Level English & Math Completion within First Year
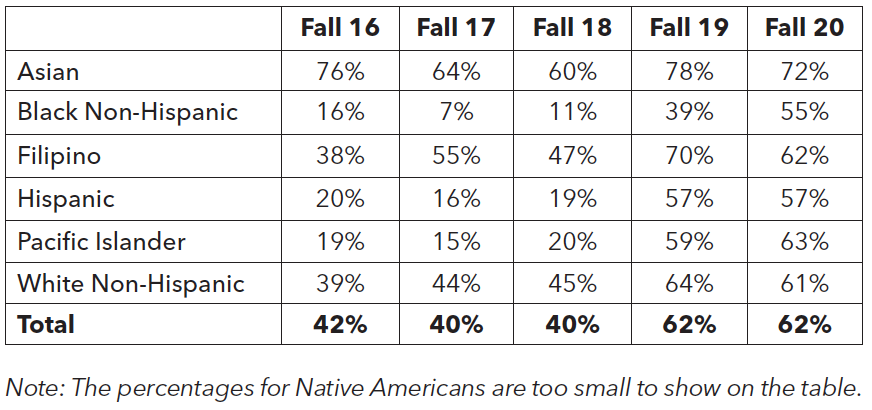
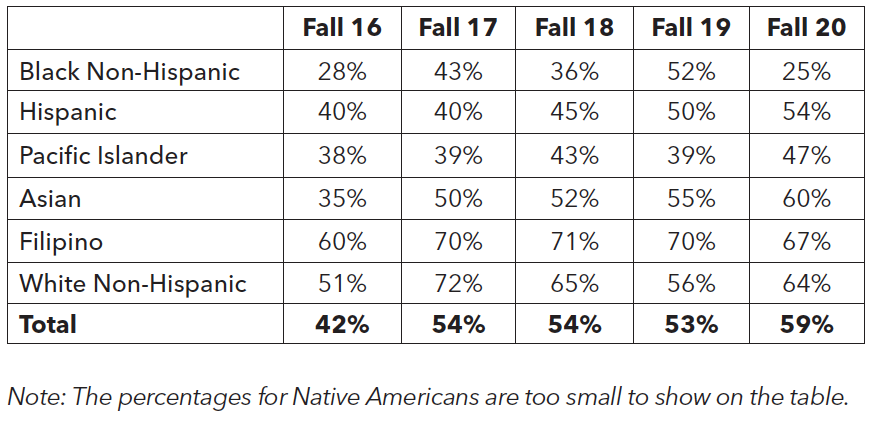
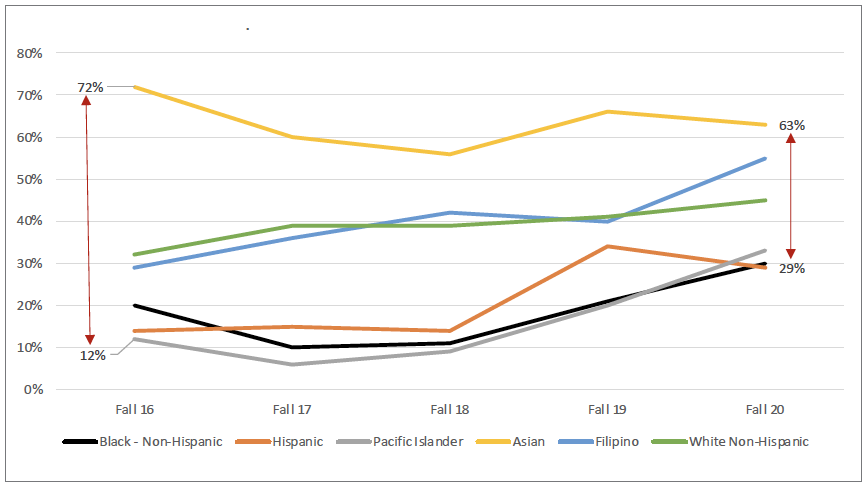
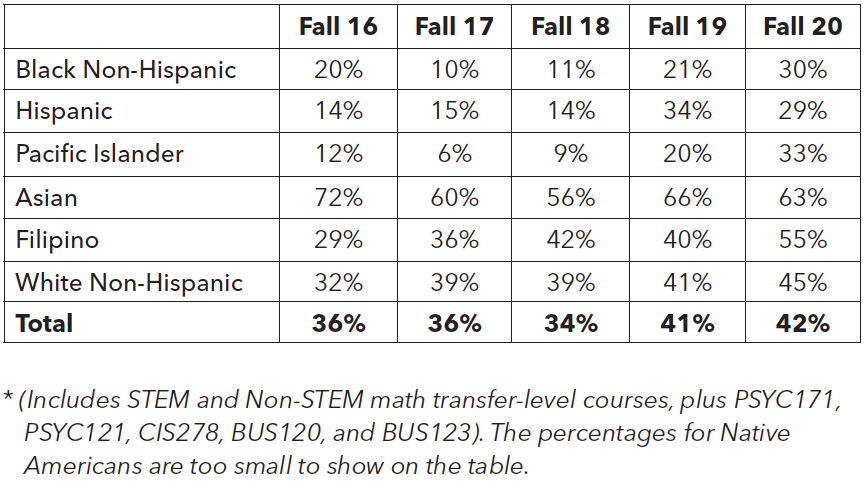
With the implementation of AB 705, CSM is working hard to increase the likelihood that first-time, degree- and transfer-seeking students complete transfer-level English and math in their first year of enrollment. It is too early to say with certainty how AB 705 will impact success rates for transfer-level English and math. So far, it is slightly associated with an increase in the completion of transfer-level English. Looking at the Fall 2020 data, 59% of students at CSM completed transfer-level English compared to 42% in Fall 2016. Unfortunately, there are clear disproportionate impacts by race/ethnicity. For example, in Fall 2020, the completion rate of transfer-level English for Black Non-Hispanic students was 25% whereas the completion rates for Asian, Filipinx, and White students were above 60%. However, caution is needed in interpreting this data due to the small population of Black Non-Hispanic students since a small change in the success count can result in a large change in the success rate. In general, one can expect metrics for larger group sizes to be more stable than metrics for small group sizes (e.g., Black Non-Hispanics and Native Americans). As for math, the completion rate for transfer-level math was 42% in Fall 2020, which increased from 36% in Fall 2016. Again, it’s too early to say how AB 705 may impact future success rates for students from various racial and ethnic backgrounds. The difference between completion rates for the lowest and highest performing racial/ethnic group for transfer-level math has ranged from a 34% gap in Fall 2020 to a 60% gap in Fall 2016. It is safe to say that so far AB 705 is not associated with increased success rates for either English or math. With time, AB 705 may rectify the inequity.
Completion of Transfer-Level English
within First Year by Race/Ethnicity
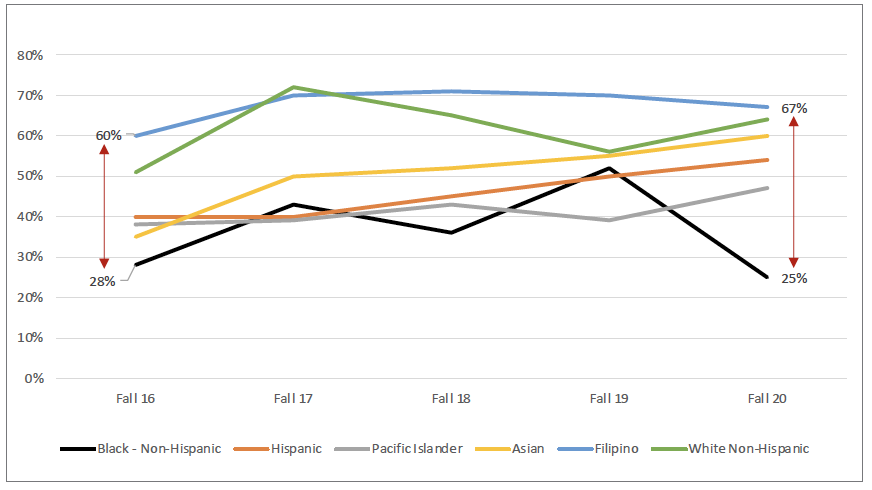
Completion of Transfer-Level Math
within First Year* by Race/Ethnicity
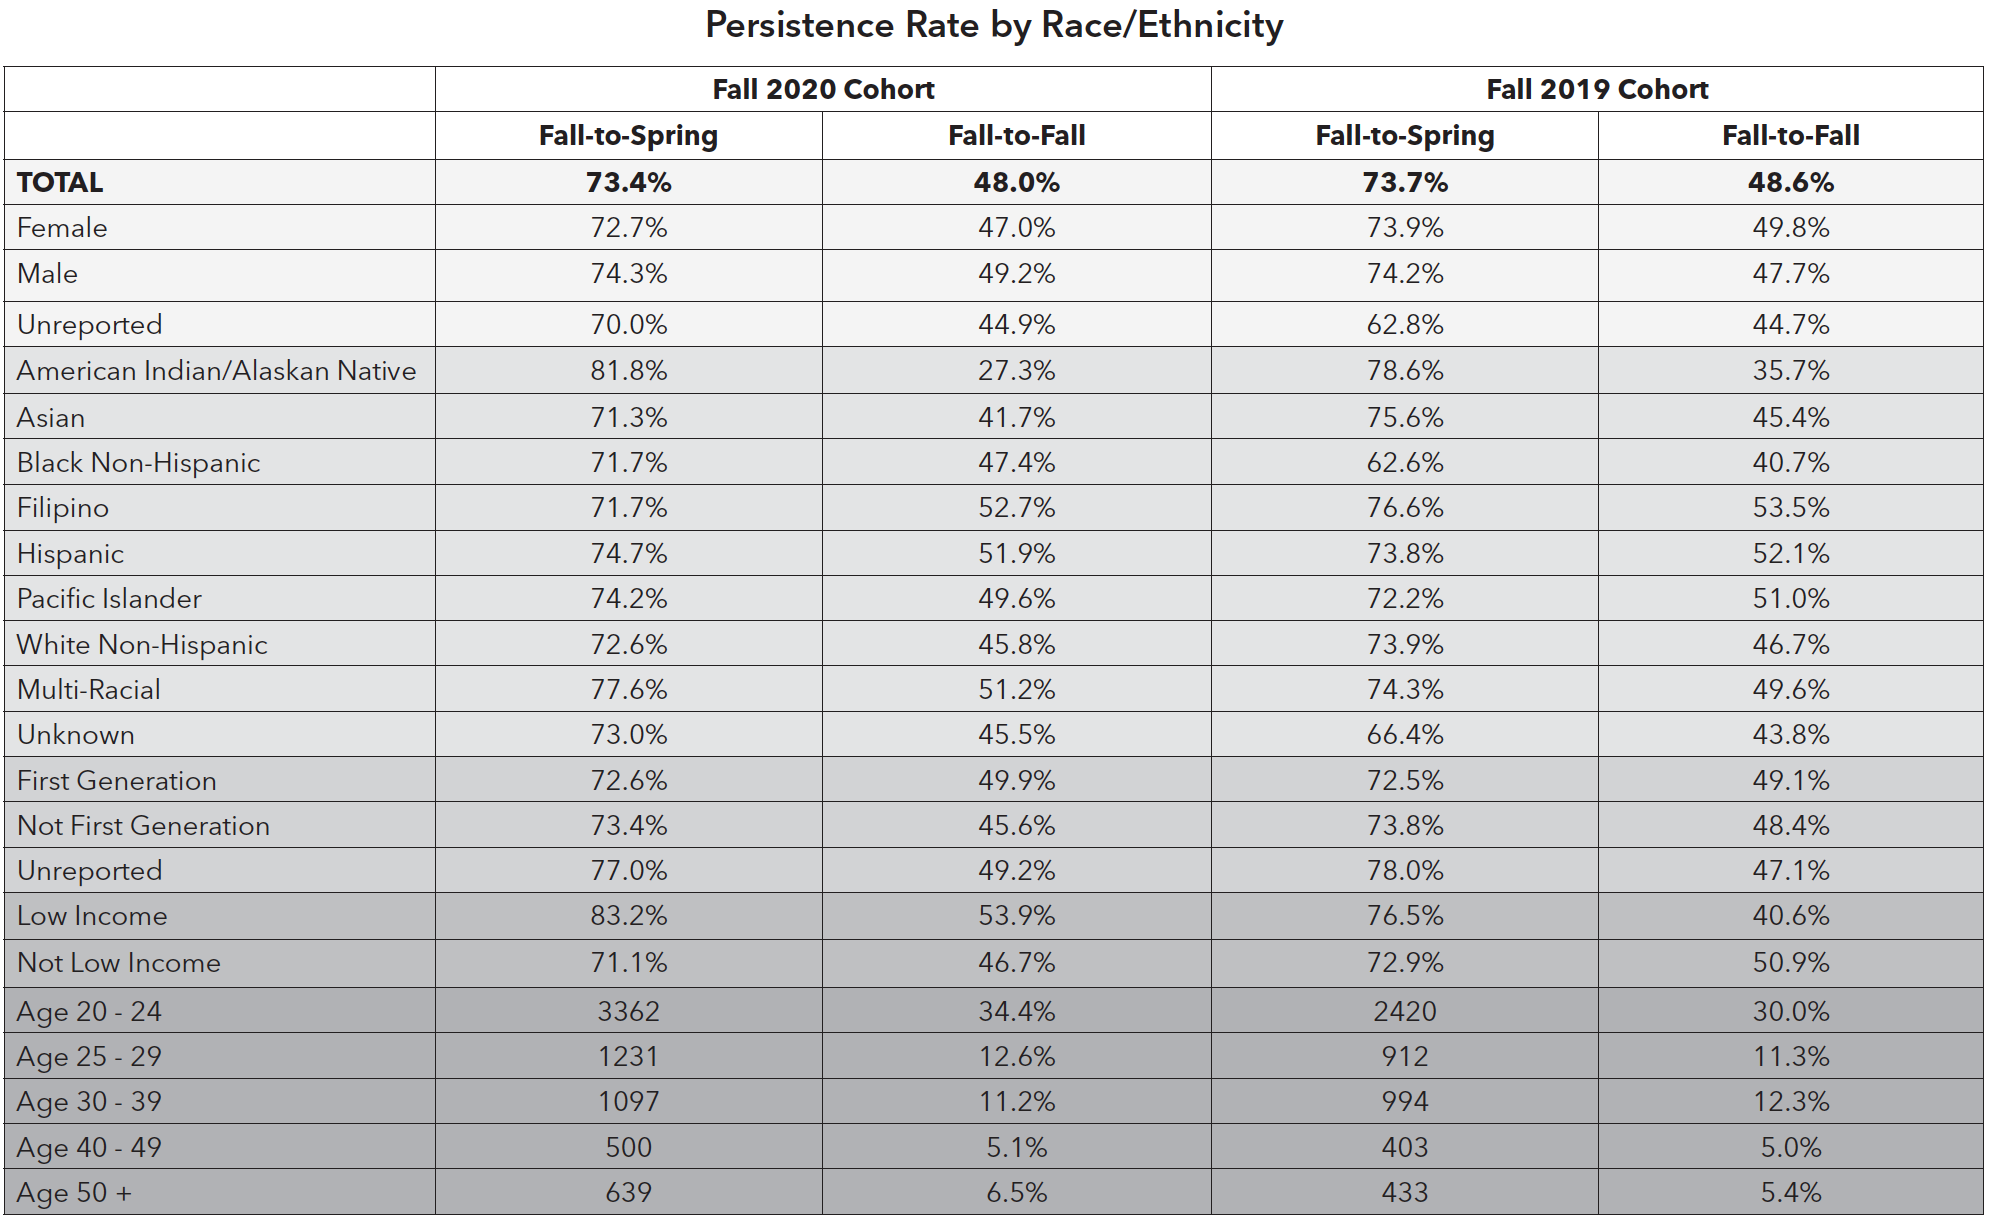
Persistence and Retention Rates
Both Fall-to-Spring (FtS) and Fall-to-Fall (FtF) persistence rates were examined for the students enrolled in Fall 2019 and Fall 2020. FtS persistence rates are typically higher than FtF rates at CSM. FtS persistence rates collegewide were 73% in Fall 2019 and Fall 2020, whereas FtF persistence rates were significantly lower at 48%. This might be due in part to the fact that some students choose to transfer in the subsequent fall term.
Course Modality
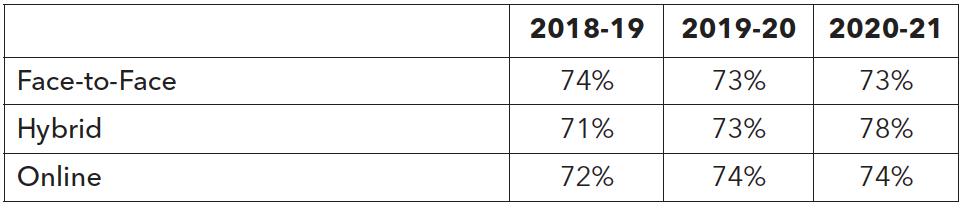
The pandemic has demonstrated the adaptability of faculty, staff, and students within a short period and revealed the capacities and capabilities of online and hybrid learning modalities as ways to deliver content to our students. In the past 3 years, hybrid courses showed higher successes than both face-to-face and online course modalities for most ethnic groups. The course success rate for hybrid learning, at 71% in 2018-19, increased to 78% by 2020-21. The course success for both face-to-face and online learning, at approximately 73%, remained the same over the past three years. However, it is too soon to conclude which learning modality is the most effective, and how it may interact with different groups of students. Thus, this data needs close and continuous monitoring going forward.
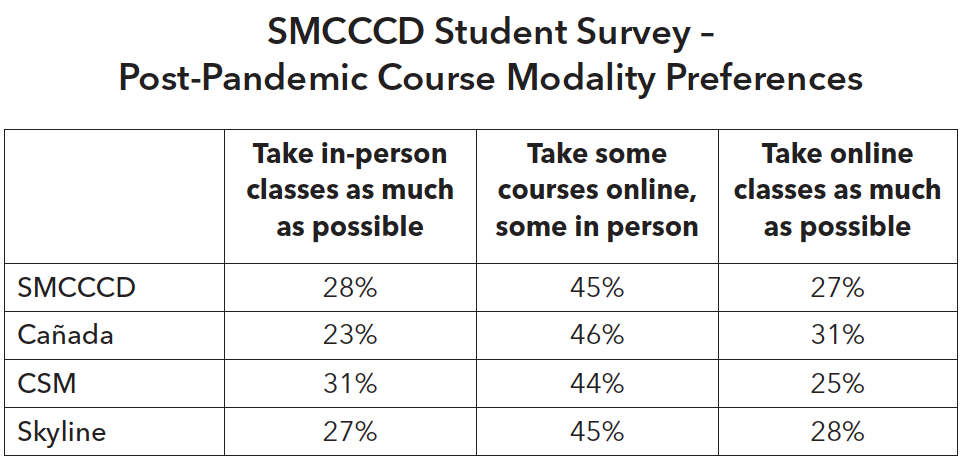
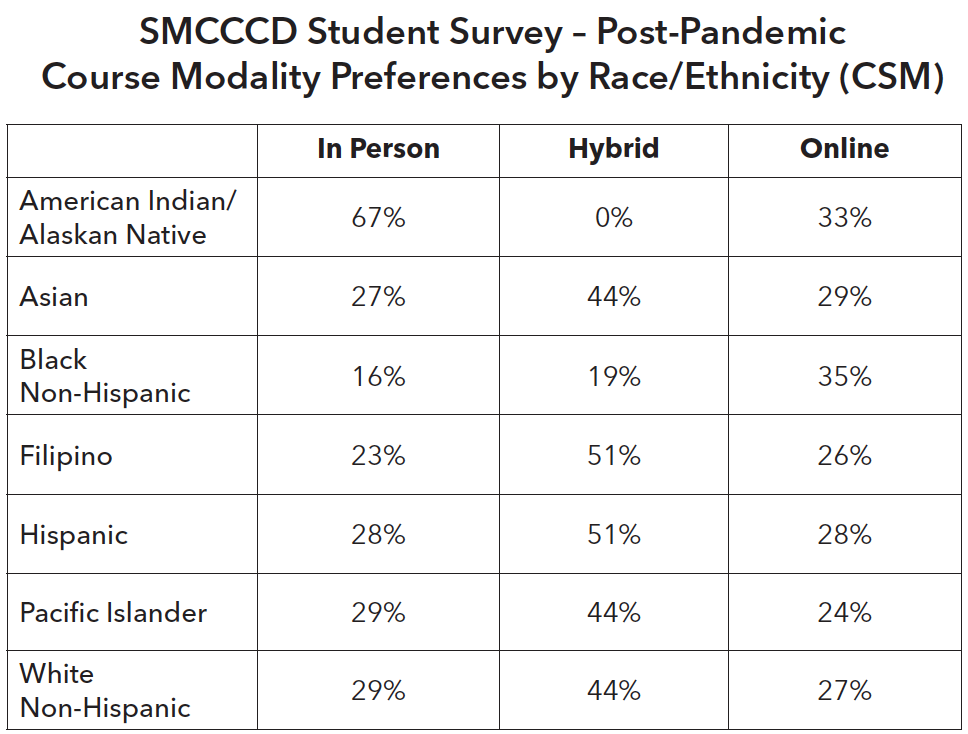
In March 2020, San Mateo County Community College District administered a districtwide survey of students to identify their needs and preferences for course modality post-pandemic. The survey results indicated that 44% students at CSM prefer mixed-modality whereas 31% prefer in-person classes and 25% prefer online classes as much as possible. The survey results at CSM were consistent with the districtwide data, and across all race/ethnicity groups.
Degrees, Certificates and Transfer Outcomes
Degrees and Certificates
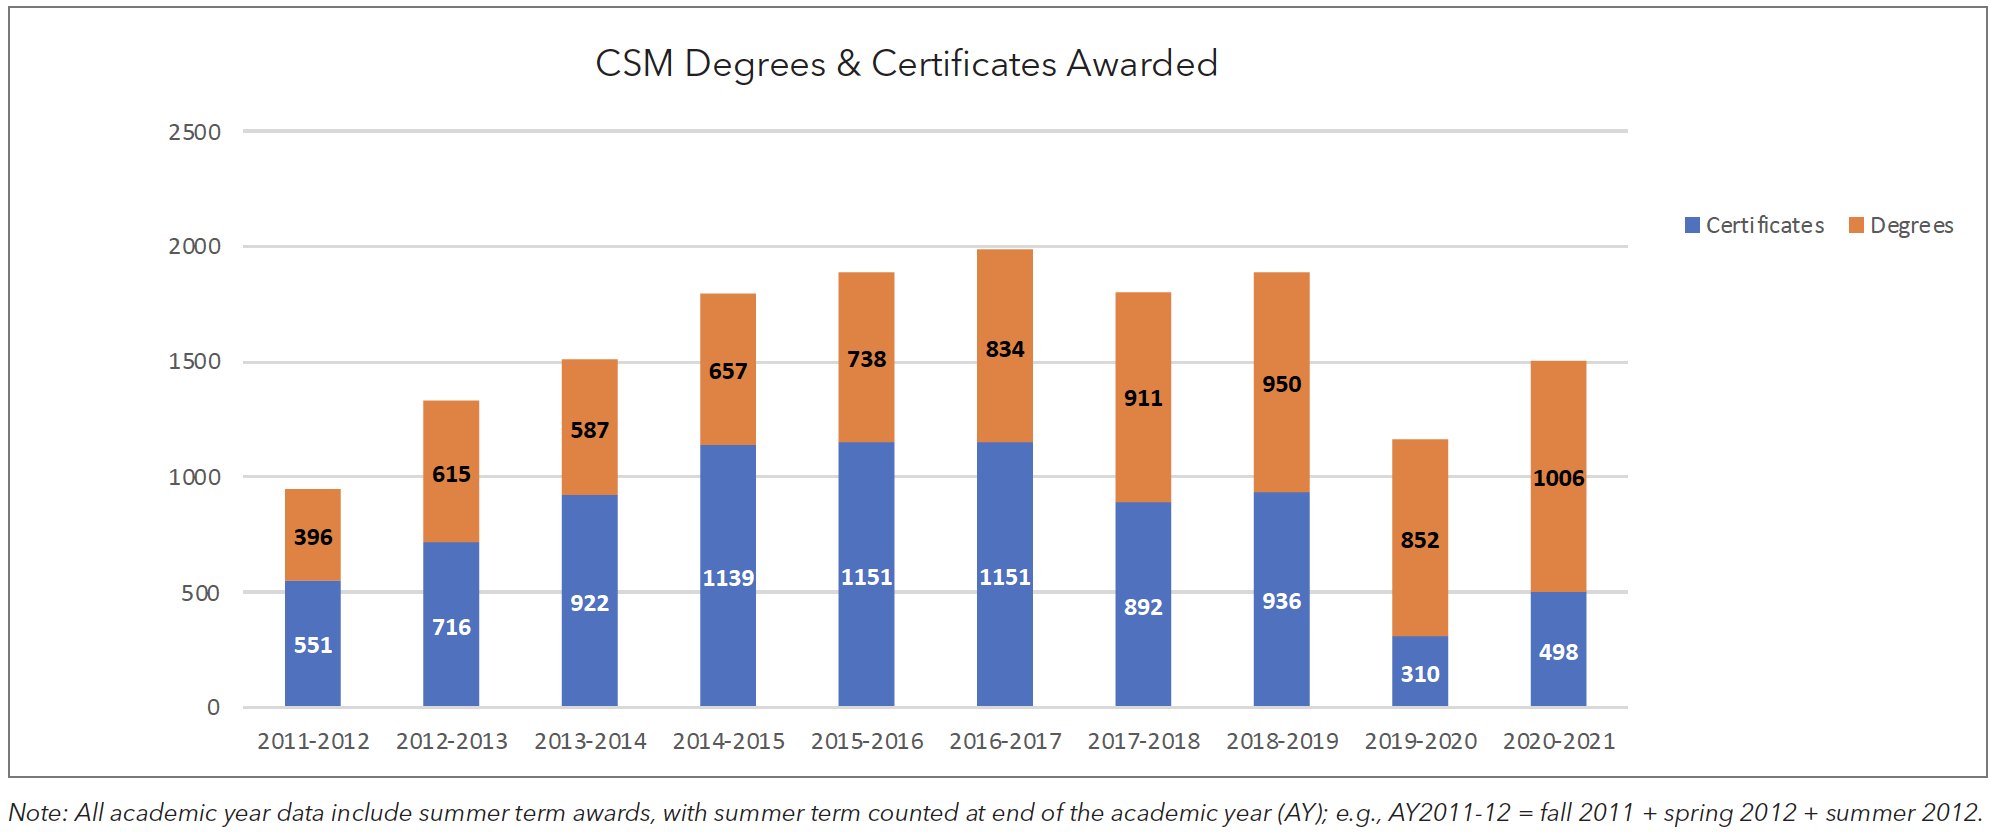
The number of associate degrees awarded by CSM has steadily increased over the past ten years. This uptick is mostly due to the introduction of Associate for Transfer degrees and growth in the number of these awarded, which constituted one-third of all degrees in 2020-2021. The number of certificates awarded at CSM has decreased in recent years as the Registrar’s Office stopped the practice of proactively awarding certificates.
For the past five years, the majors that produced the most degrees and certificates are Communication Studies (125), Business (123), Computer & Information Studies (106), and Accounting (101).
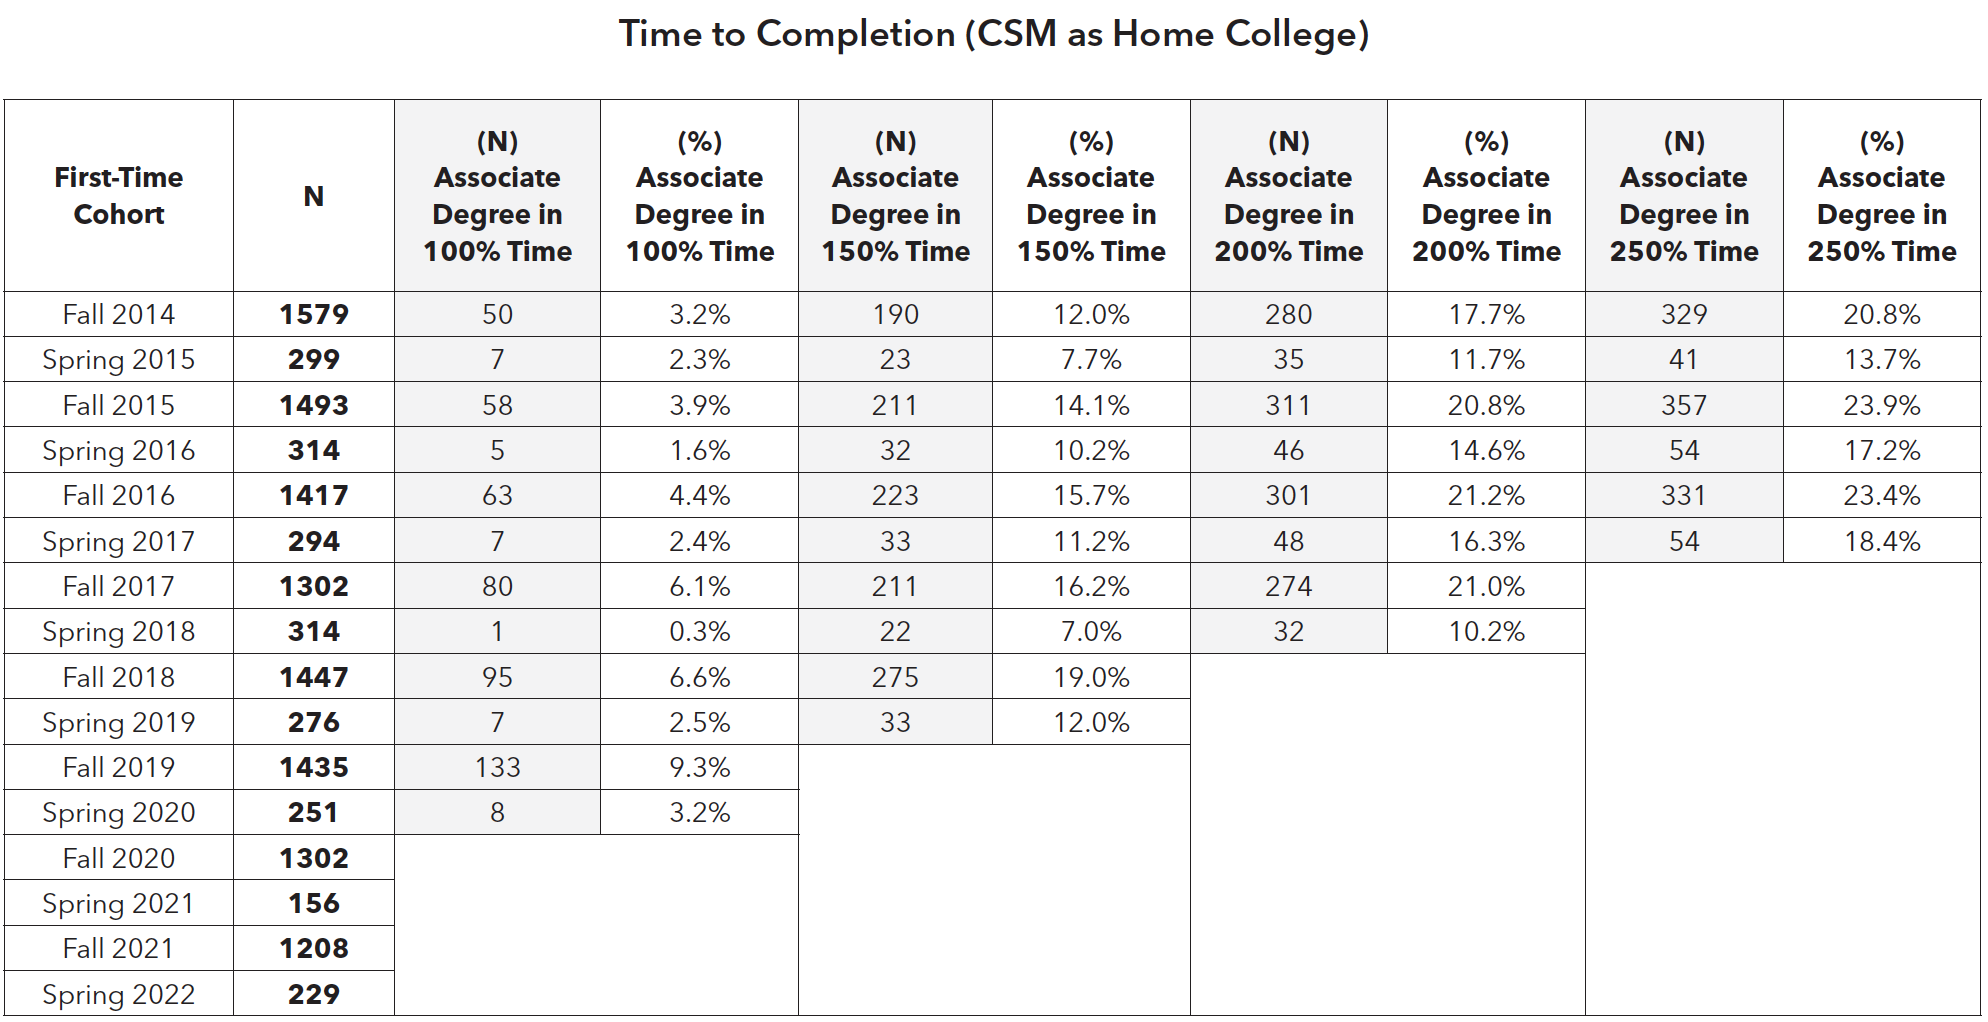
Approximately 60% of students come to CSM with the goal of attaining degrees and certificates or transfer to a four-year institution. However, CSM can improve efforts to ensure degree- and transfer-seeking students achieve their educational goals. Less than 10% of the first-time cohort attained a two-year degree within two years, although time to degree completion within two, three or four years increases at a small rate.
Transfer
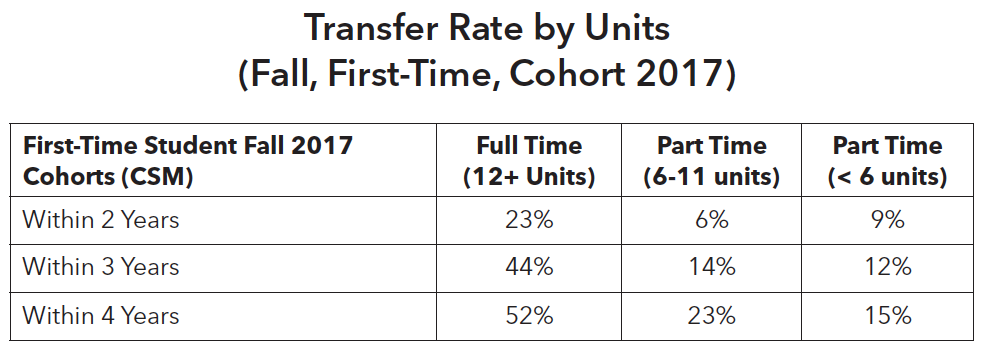
Students transfer to four-year institutions both within and outside of California. However, the majority of students stay in California to attend the public institutions of the University of California and California State University systems. Using the 2017 cohort, 44% of full-time, degree-seeking students transferred to four-year institutions whereas 14% of part-time, degree-seeking students do so within three years.
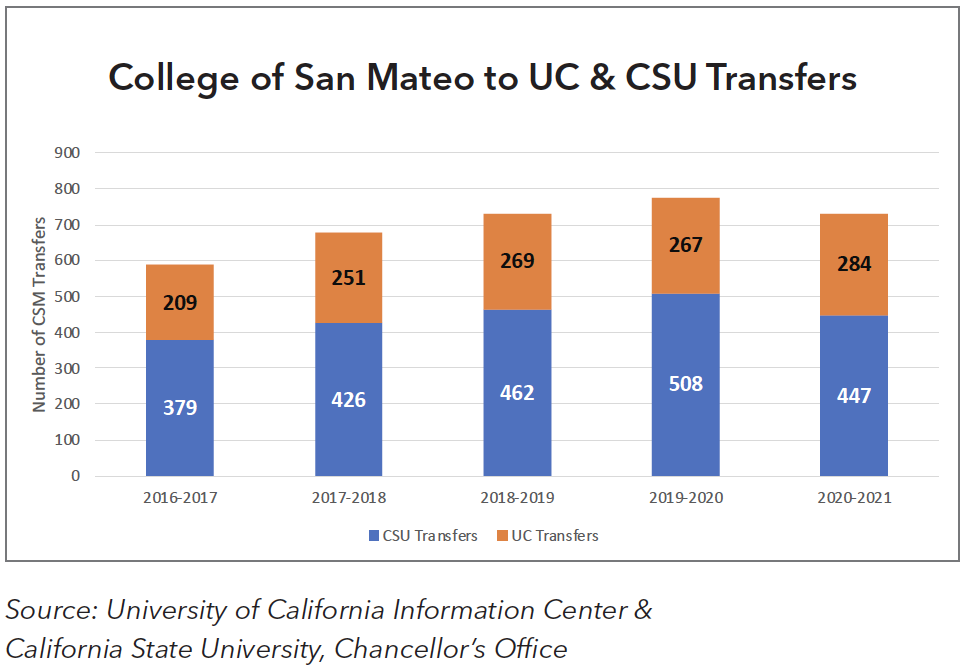
Transfer to California four-year public institutions has increased over the last five years among the students at CSM. The UC and CSU transfer numbers decreased in 2020-21, which is likely due to the COVID-19 pandemic.
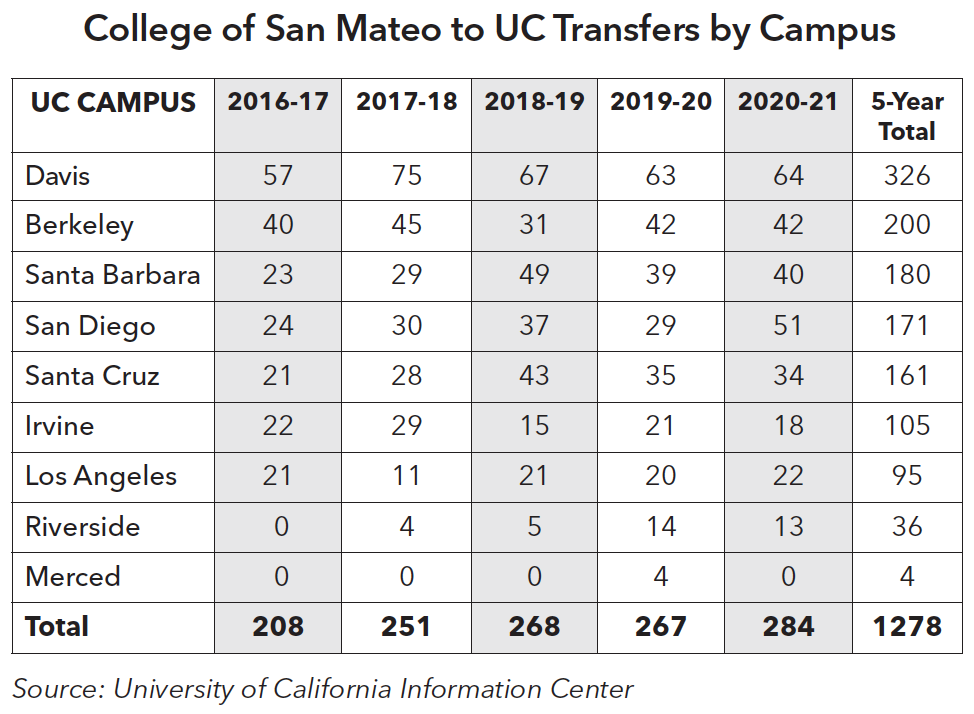
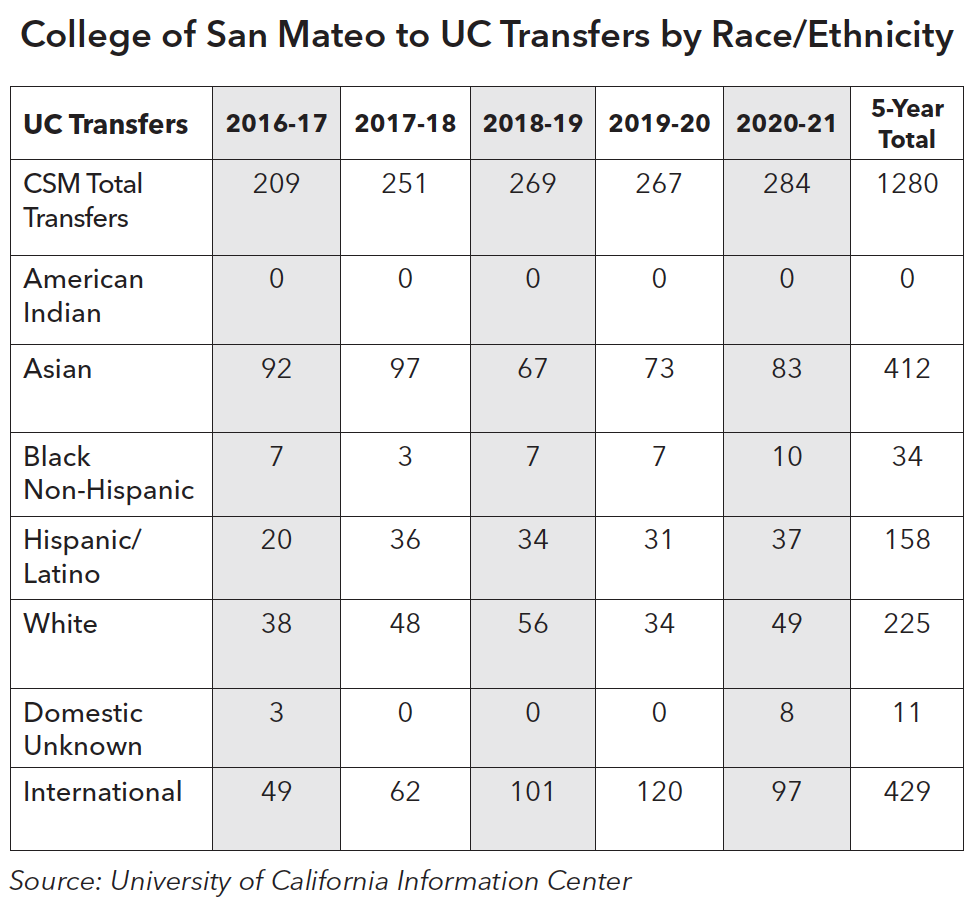
Among CSM students who transferred to a University of California campus over the past five years, the main transfer destination was Davis, followed by Berkeley and Santa Barbara. UC transfers have ranged from 208 in 2016-17 to 284 in 2020-21.
In 2020-21, the largest number of students who transferred to UC identified as Asian (83) followed by international students (97).
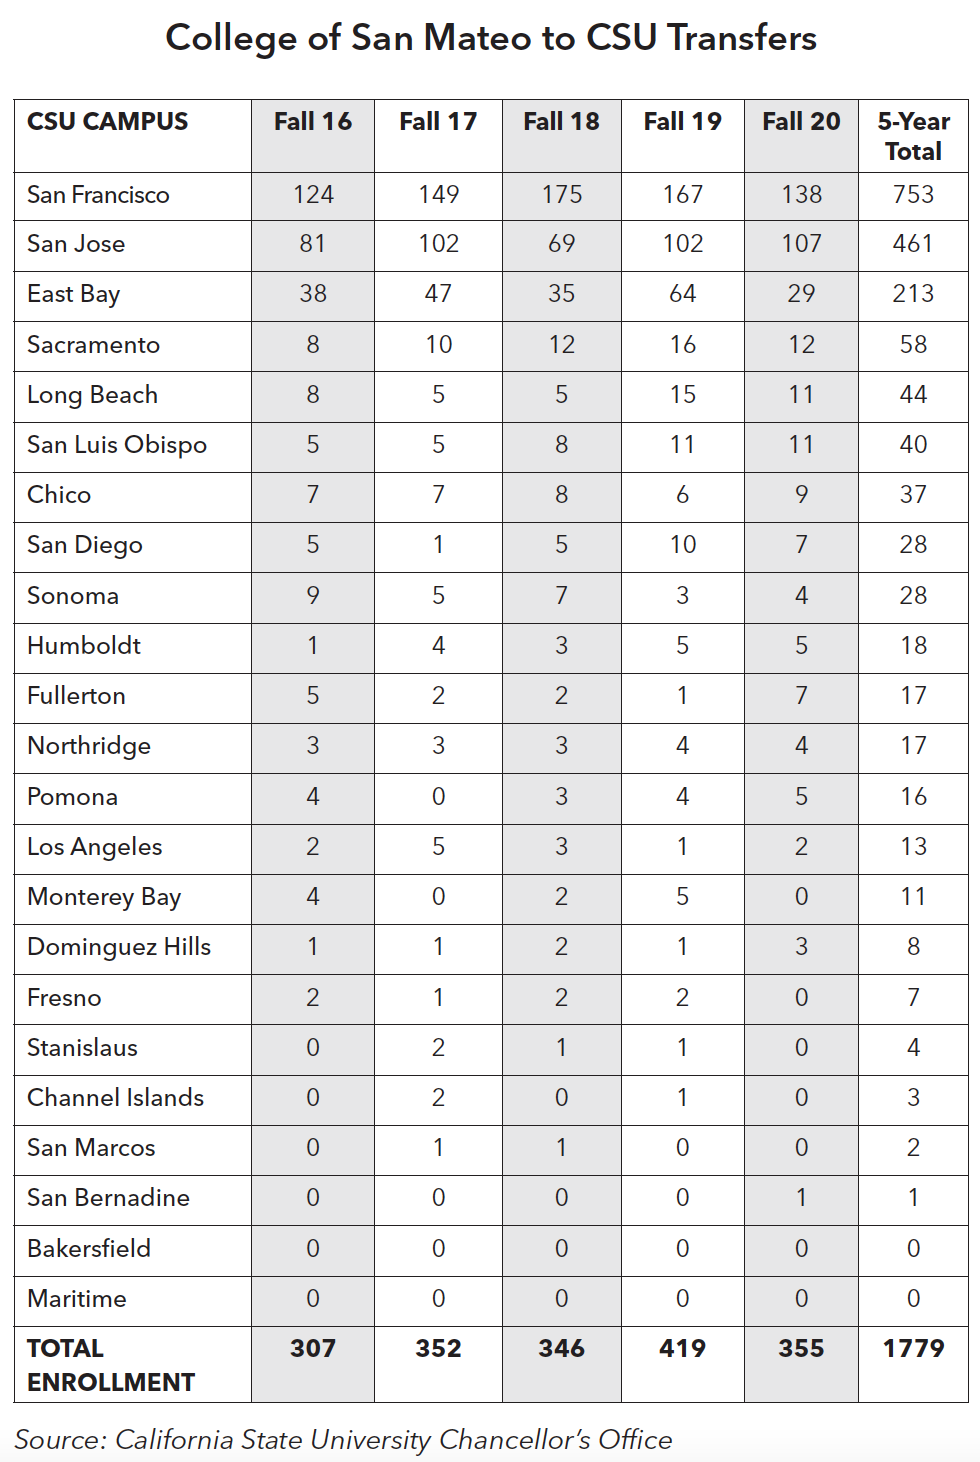
In terms of specific California State University campuses to which CSM students transfer, San Francisco State University (SFSU) and San Jose State University (SJSU) have consistently been the top destinations by a significant margin.
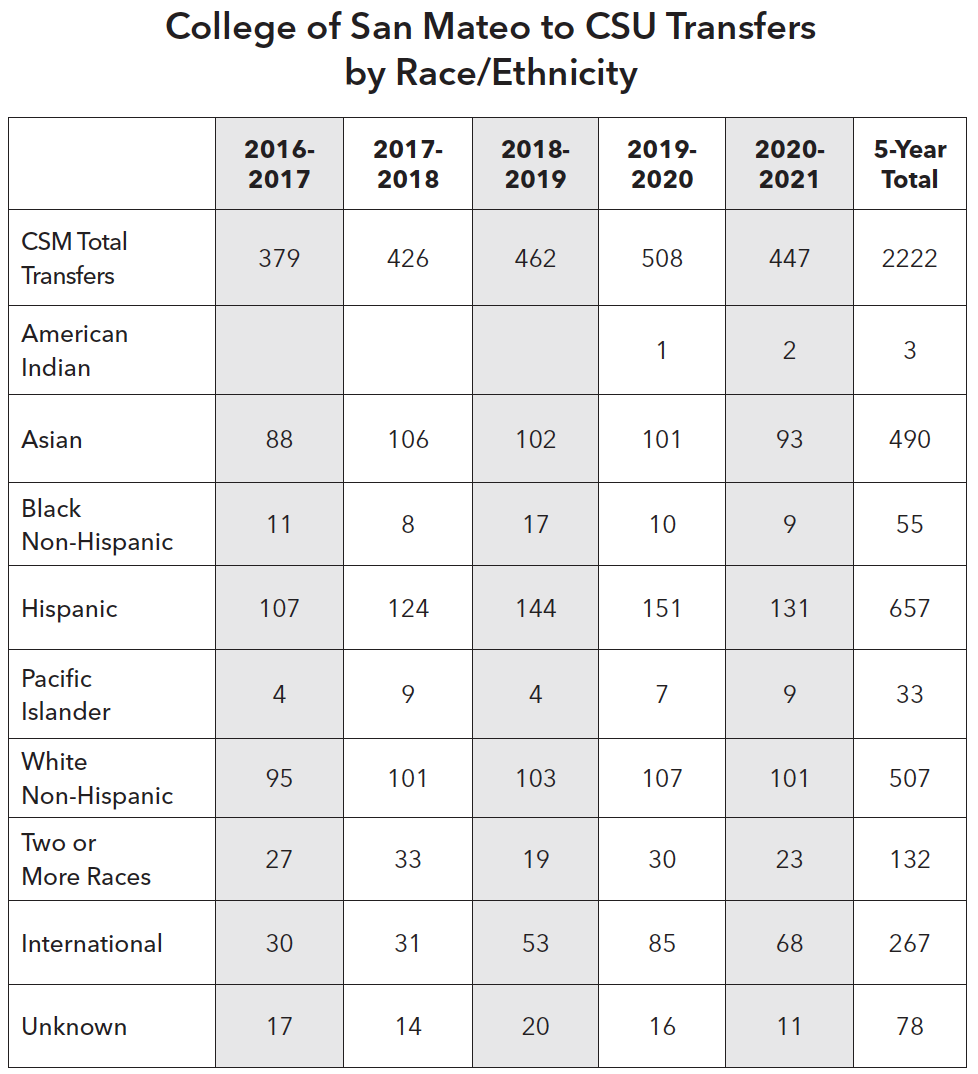
The largest number of CSM students who transferred to CSUs identified as Latino/a/x (657) followed by White (507) and Asian (490). Two groups that were low in CSU transfer numbers were Black Non-Hispanic (55) and Pacific Islander (33). More efforts are needed to support these two groups in transferring to CSUs.
Career & Technical Education
CSM offers 96 Career and Technical Education (CTE) programs, including 53 Certificates of Specialization, 18 Certificates of Achievement, 8 Associate in Arts (AA) degrees, and 14 Associate in Science (AS) degrees.
From 2015-16 to 2020-21, CSM conferred a total of 4,676 awards to 3,463 students in CTE programs. A six-year look at the number of CTE certificates and degrees awarded reveals a 31% decrease in the number of awards conferred (628 awards vs. 916 awards, respectively). The decrease is due to a significant drop (-60%) in the number of certificates awarded in recent years. The count of AA and AS degrees awarded in CTE programs remained relatively stable over the last six years, with a slight dip in AA degrees in the most recent year.
Students at College of San Mateo who earned a certificate of 6 or more units, earned a vocational degree, or earned 9+ CTE units were surveyed to understand student perceptions of their CTE program, employment outcomes, and how their coursework and training relate to their current career. A total of 1009 students were surveyed and 245 students responded (24%). The results of the survey showed that completing CTE studies and training is related to positive employment outcomes.
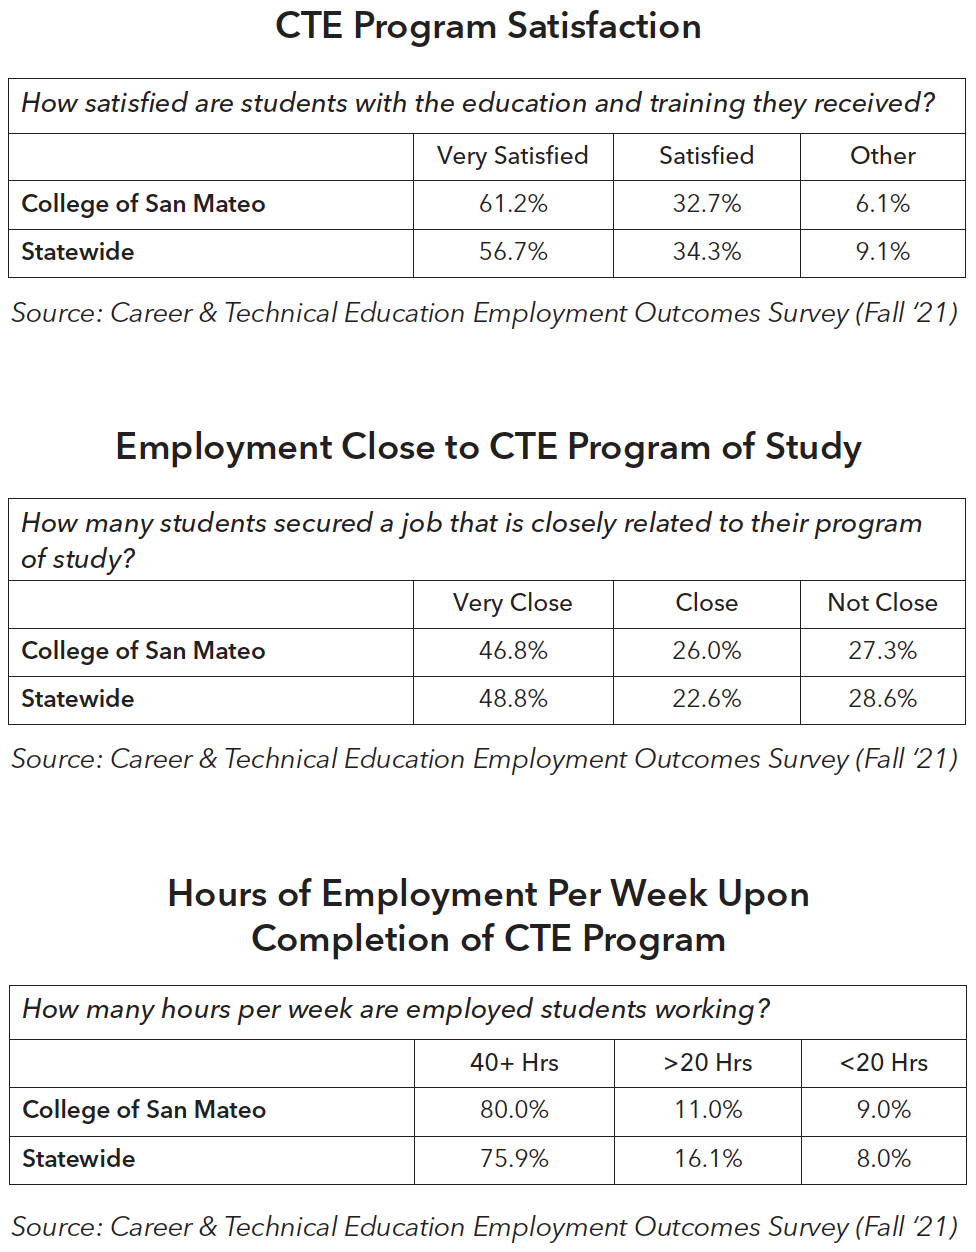
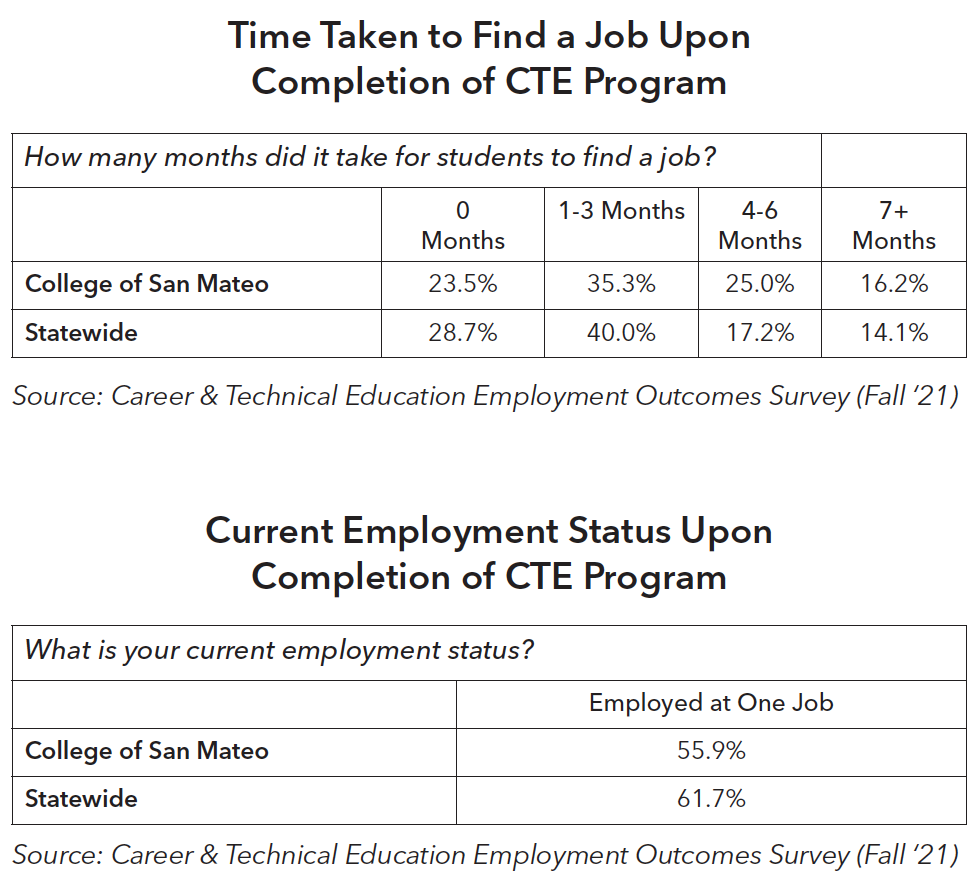
More Key Career & Technical Education Employment Outcomes Survey Results:
- $15.00 is the overall change in hourly wages after completing CTE training
- 60% is the overall change in hourly wages after completing CTE training
- 71% of respondents reported being employed for pay
- 49% of respondents reported transferring to another college or university
- 94% of respondents reported being very satisfied or satisfied with their CTE training