
APPENDIX A: External Scan
The three colleges of the San Mateo County Community College District — College of San Mateo, Cañada College, and Skyline College — serve the more than 767,000 residents who live in San Mateo County and beyond. To update educational master plans, the three colleges are assessing the dramatic changes in the context in which they operate from a local, regional, national, and global perspective. For example, worldwide, forces related to climate change, the COVID-19 pandemic, California wildfires, and racial reckonings are impacting the region where the colleges operate in new and dramatic ways. Likewise, the overwhelming success of the Silicon Valley and larger Bay Area economies also affects the communities the colleges serve positively and negatively. This document summarizes relevant trends and their likely impacts on the colleges and the communities they serve.
Summary of Key Take-Aways
- The cost of living in the region continues to soar, making it nearly impossible for low-wage workers to have time to attend school while working.1
- The pandemic has exacerbated long-term socio-economic trends in the region: worsening income disparities, longer commutes, and a greater incidence of housing insecurity and homelessness in the Bay Area.
Demographic shifts in the region point to a population that will be older, better educated, and wealthier, displacing low- and moderate-income families and communities.
Low- and moderate-income earners have been hit the hardest by the pandemic. There has been a disproportionate impact on Black, Indigenous & People of Color (BIPOC) students and families in the region.
- Gaps in educational attainment persist and further divide regional residents in terms of economic mobility. Education leads to economic mobility in Silicon Valley.
- School-age populations are projected to decline, as is the number of high school graduates who attend college.
- Employment demand in San Mateo County is predicted in occupations requiring a bachelor’s degree or higher, including technology, health care, and management services.
- Higher education is working to understand the pandemic-related shift in enrollments, technology, and the future of in-person instruction and services.
- Declining enrollment will require creative problem solving that includes key challenges to post-pandemic enrollment operations: Course modality; intensive student supports; and recruitment, retention, and succession planning of college employees.
Economic Trends
Life in San Mateo County, and Silicon Valley in particular, continues to become more and more expensive. The success of technology companies such as Facebook, Google, and Apple brings wealth to the region, drives up the cost of living, and exacerbates the already alarming trends in the price of housing in the area.
Cost of Living
According to the Bureau of Labor Statistics and Best Places, the overall cost of living in San Mateo County in 2021 is more than two and a half times the national average. The median price of a home is more than six times the national average.2
Transportation
To access economic opportunities and education in the region, many employees and students move to cities farther away and commute — sometimes many hours per day — to afford a house and keep a reasonable balance between their income and cost of living.
The cost of basic transportation needs has risen continually over the past decade, outpacing the inflation rate. The costs rose to such a height in 2021 that a Silicon Valley family of four with two minimum wage workers would have to spend 14% of their pre-tax income to share one car (Silicon Valley Index 2022). These rising costs affect students trying to attend college and faculty and staff commuting to SMCCCD.
Over time, the increase in the cost of living in San Mateo County has required the SMCCCD to raise salaries to attract faculty and staff, yet in many instances, faculty and staff newer to the region find living and commuting in the area unsustainable.
Income Disparities
The Silicon Valley region is home to some of the world's most significant disparities in income and wealth. The gap between rich and poor has worsened over time for those living in the area.
The COVID-19 pandemic has exacerbated these trends. As of July 2021, 13.7% of San Mateo County rental households were behind on paying rent.
Between January 2020 and July 2021, San Mateo County experienced the most significant increase in food stamp enrollment in the State of California, with a 41% jump in the number of people here relying on CalFresh.3
Lower-income workers in San Mateo and Santa Clara Counties saw their wages drop more severely and rebound more slowly due to the COVID-19 pandemic.
As incomes decline or stagnate, and the cost of living continues to rise, low- and moderate-income families are frequently displaced — some forced out of their homes due to evictions or rising rents, others due to the loss of wages or employment. As a result, the region has lost low- and moderate-income households and gained only upper-income households over time.
When incomes are disaggregated by race and ethnicity, the wide gaps in the ability of San Mateo County residents to prosper are evident.
Similarly, as home to the world’s most successful “knowledge economy,” the Silicon Valley region is also home to wide gaps between residents by education level.
The importance of education to survive and thrive in San Mateo County cannot be understated. Education is a crucial indicator of economic mobility.
Educational Attainment
There is a clear correlation between an individual’s level of education and income in San Mateo County. A high income is needed to live and raise a family in the County. A large percentage of County residents (42%) have a high school education with (or without) some vocational training. When disaggregated by race and ethnicity, the disparities in educational attainment are pronounced with BIPOC residents facing pronounced challenges.
Self-Sufficiency and Poverty
Given these income and education disparities, it follows that nearly 30% of San Mateo and Santa Clara County households are living in poverty and below self-sufficiency standards.
Population and Demographic Trends
The population of San Mateo County is expected to grow 24% over the next 40 years, according to the California Department of Finance.
An Aging Population
Most of this growth is projected to come from older residents, ages 65 and up, followed by an increase in working-age residents ages 25-44. Younger residents — children, teens and young adults — are expected to decline significantly as a proportion of the overall population. As a result, the California Department of Finance is projecting that the total enrollment in grades K-12 in San Mateo County will decrease by 14% by 2030-31 (see chart).
When considered by race and ethnicity, the only racial group projected to decline as a share of the total County population is the White population. Hispanic, or Latinx, residents will continue to increase as a share of the total, as they are projected to do statewide. Other groups are expected to remain unchanged.
Human Capital4
Present and future workforces are dependent upon our students' preparation. Human capital fuels the workforce, and any shifts are relevant to higher education for educators and employers. Employment shifts challenge prospects for our students, our current workforce, and the future workforce.
Demographics and post-pandemic challenges are creating human capital challenges for all industries. According to an EMSI 2021 study, the United States is facing a demographic drought that will affect our workforce for years to come. A shortfall of 8.5 million workers is predicted to cause higher education institutions and businesses to desperately compete for recruits who don't exist. The U.S. stands to lose $162 billion annually due to talent shortages. Hiring and recruiting will be increasingly competitive as employers scramble for a diminishing supply of talent. The U.S. labor force participation rate has fallen dramatically, shrinking the pool of talent for would-be employers.
With fewer children born in the U.S., K–12 enrollment was already projected to fall by 8.5% before 2030. But after the events of 2020, enrollment is likely to slip even lower. Meanwhile, a report by EAB states that delayed college plans, combined with the spike in high school dropout rates during COVID, will drive college enrollment numbers lower still. Even the best-case projections look grim. Companies can no longer expect to hire the perfect candidate off the shelf. In fact, pulling any candidate off the shelf is getting harder. On-the-job training, in-house recruitment, and high retention rates will be among the key survival strategies for human resources departments. Broader recruitment strategies, targeted skills training, and higher retention can keep the talent pool from drying up prematurely.
A LinkedIn study, including data from its 800M members and 58M companies, identified 2022 employment trends resulting from the pandemic. Specifically, LinkedIn’s team of economists and data scientists identified three key trends worth watching in 2022:
- How we work: Remote and hybrid work attract over 2.5 times the share of job applications compared to onsite jobs. In March 2020, only every 1 in 67 paid jobs in the U.S. offered remote work. By the start of 2022, that number ballooned to nearly 1 in 6.
- Where we work: Workers are moving into new roles at an accelerated pace, with job changes in the U.S. up 37% year over year.
- Why we work: Workers feel empowered to demand more out of work. Job seekers prioritize work-life balance (63%), compensation and benefits (60%), and colleagues and culture (40%) as their top priorities for employment.
LinkedIn noted additional workforce shifts in the SF and South Bay areas, where the region continues to see a net loss of workers migrating to other states.
CSM relies on the excellence of faculty and staff to serve our students. We pride ourselves on our ability to serve all populations. Our ability to continue to attract and retain a high-quality, diverse faculty and staff to meet our community's needs is critical to our students' success. Recruitment, retention, and succession planning strategies will enable CSM to maintain high-quality education and services to our community.
Regional Industry and Workforce Trends
In the heart of the Silicon Valley region, San Mateo County is home to (or near) some of the fastest-growing and most profitable companies worldwide, including Facebook, Genentech, Apple, and Google. The major employers in the County include5:
| Employer Name | Location | Industry |
|---|---|---|
| BART Daly City Station | Daly City | Transit Line |
| Electric Charging Station | Menlo Park | Research Service |
| Electronic Arts Inc | Redwood City | Game Designer - Manufacturer |
| Facebook Inc | Menlo Park | Social Media |
| Fisher Investments | San Mateo | Investment Management |
| Fisher Investments | Woodside | Investment Management |
| Forced Dump Debris Box Service | Burlingame | Garbage Collection |
| Genentech Inc | South San Francisco | Biotechnology Products & Services |
| Gilead Sciences Inc | Foster City | Biological Products - Manufacturer |
| Kaiser Permanente - RWC | Redwood City | Hospital |
| Kaiser Permanente - SSF | South San Francisco | Hospital |
| LSA Global | Redwood City | Training Consultants |
| Mills-Peninsula Medical Center | Burlingame | Hospital |
| Motif Inc | San Mateo | Business Services NEC |
| Oracle Corp | Redwood City | Computer Software - Manufacturers |
| Palo Alto VA Hospital/Medical Center | Menlo Park | Government - Specialty |
| Plateau Systems | San Mateo | Computer Software |
| San Francisco Intl Airport-SFO | San Francisco | Airport |
| San Mateo County Behavioral Health | San Mateo | Government Office - County |
| San Mateo County Tax Collector | Redwood City | Tax Return Preparation & Filing |
| San Mateo Medical Center | San Mateo | Hospital |
| Sciex LLC | Redwood City | Scientific Apparatus & Instrument Manufacturer |
| SRI International | Menlo Park | Engineers - Research |
| Visa Inc | Foster City | Credit Card & Other Credit Plan |
| Youtube LLC | San Bruno | Online Service |
Many of these employers experienced dramatic growth during the COVID-19 pandemic and, as a result, the region’s unemployment rate recovered fairly quickly after the initial spike at the beginning of the pandemic6:
Wage Differences
The difference in wages paid by various industries and employers in the region makes it difficult to analyze regional income trends.
Technology firms play an outsized role in the Silicon Valley economy. These companies produce many of the region's "Tier 1" jobs which require a high level of skill or educational attainment and pay a high wage. Yet technology-related companies directly employ slightly less than a third of the regional workforce.
In contrast, the majority of jobs in the region are "Tier 3" jobs that require less skill and pay a much lower wage. For example, community infrastructure & services and business infrastructure & services activities create more low-skill, low-wage jobs than any other kind of job. Together, they also employ two-thirds of the region's workforce.
Since 2019, however, only the innovation and information products and services sector (high-skill, high-wage jobs) experienced positive job growth. All other sectors experienced negative growth between 2019 and 2020.
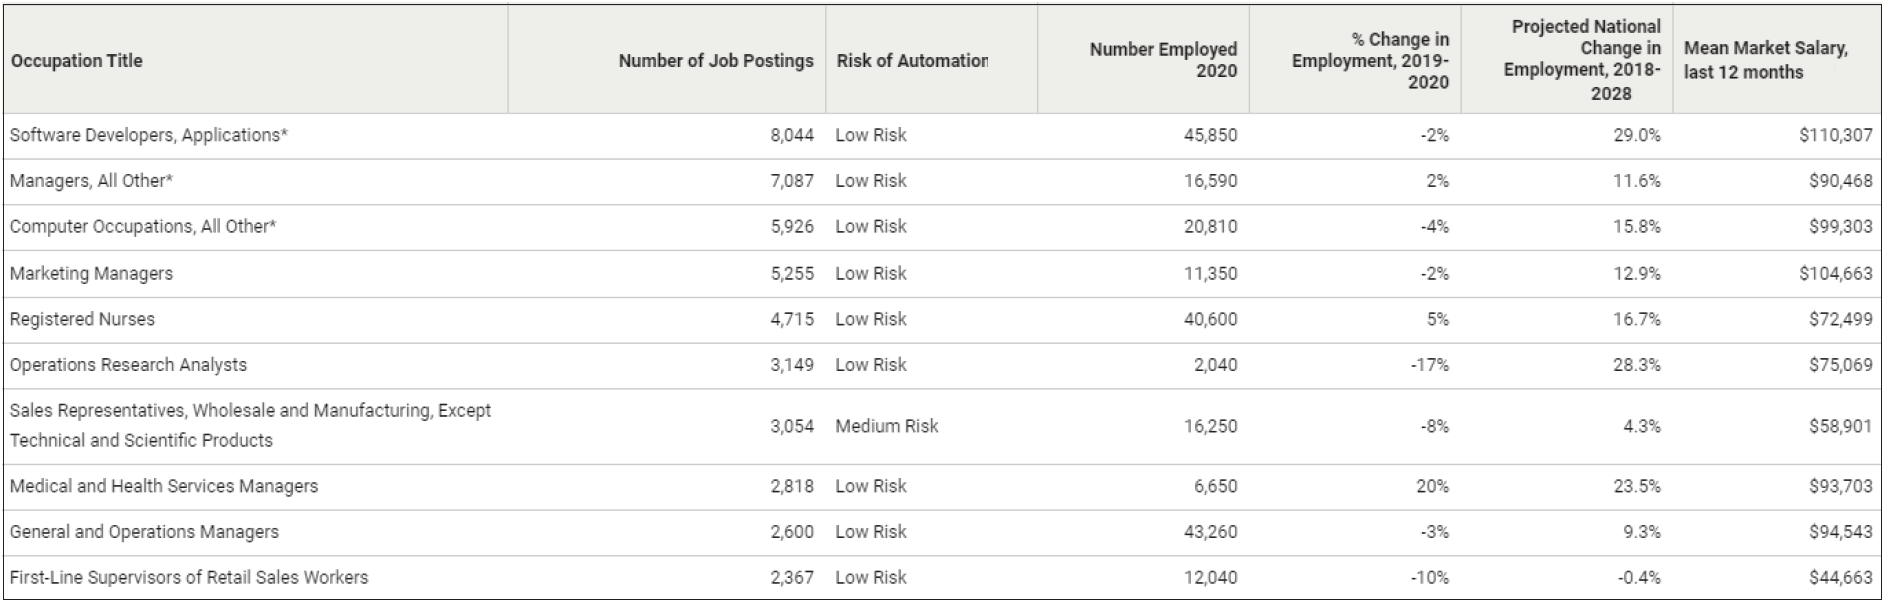
During the period between December 1, 2020, and November 30, 2021, occupations with the most job postings and which require at least a bachelor’s degree in San Mateo County, according to Labor Insight included7:
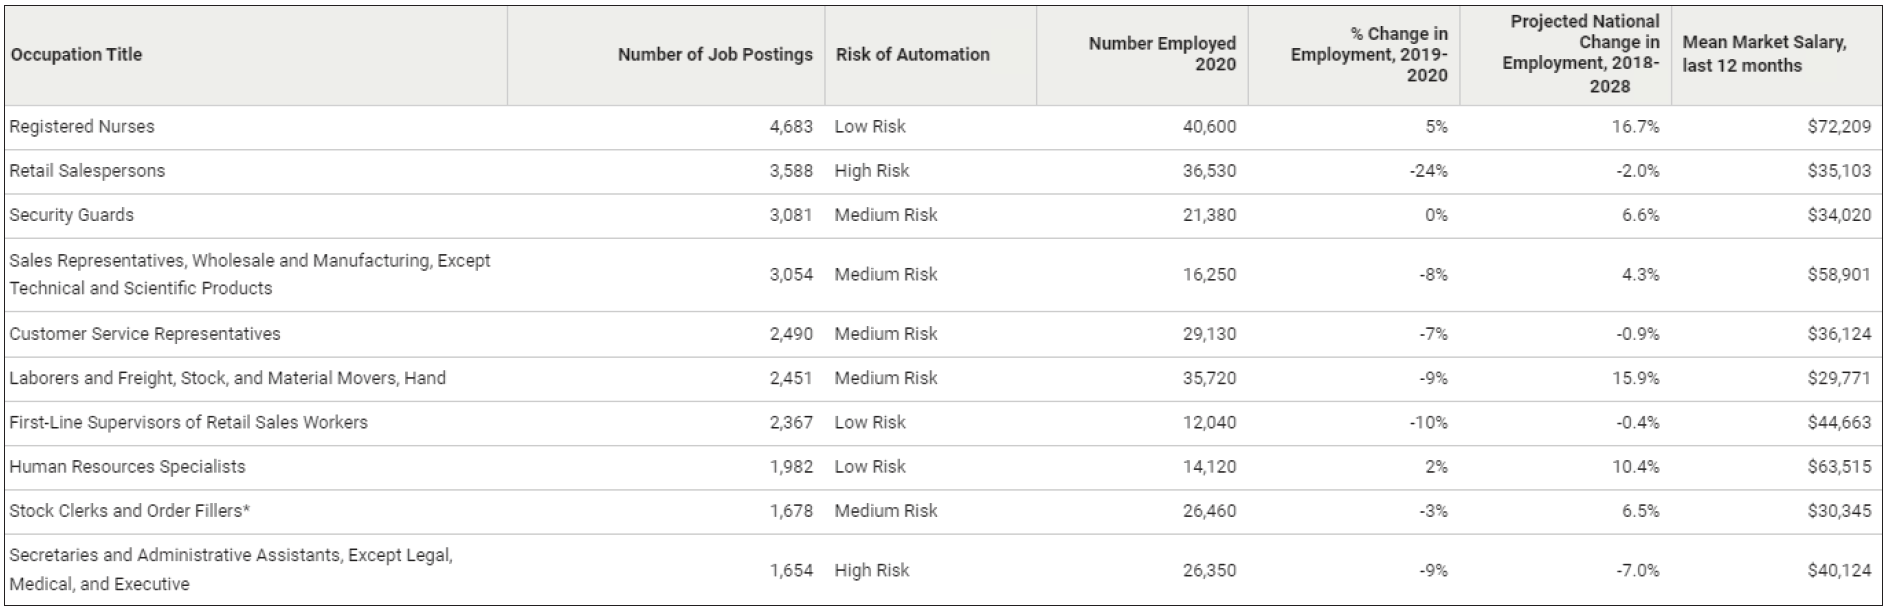
The occupations with the most job postings during the same period and location that required less than a bachelor’s degree included8:
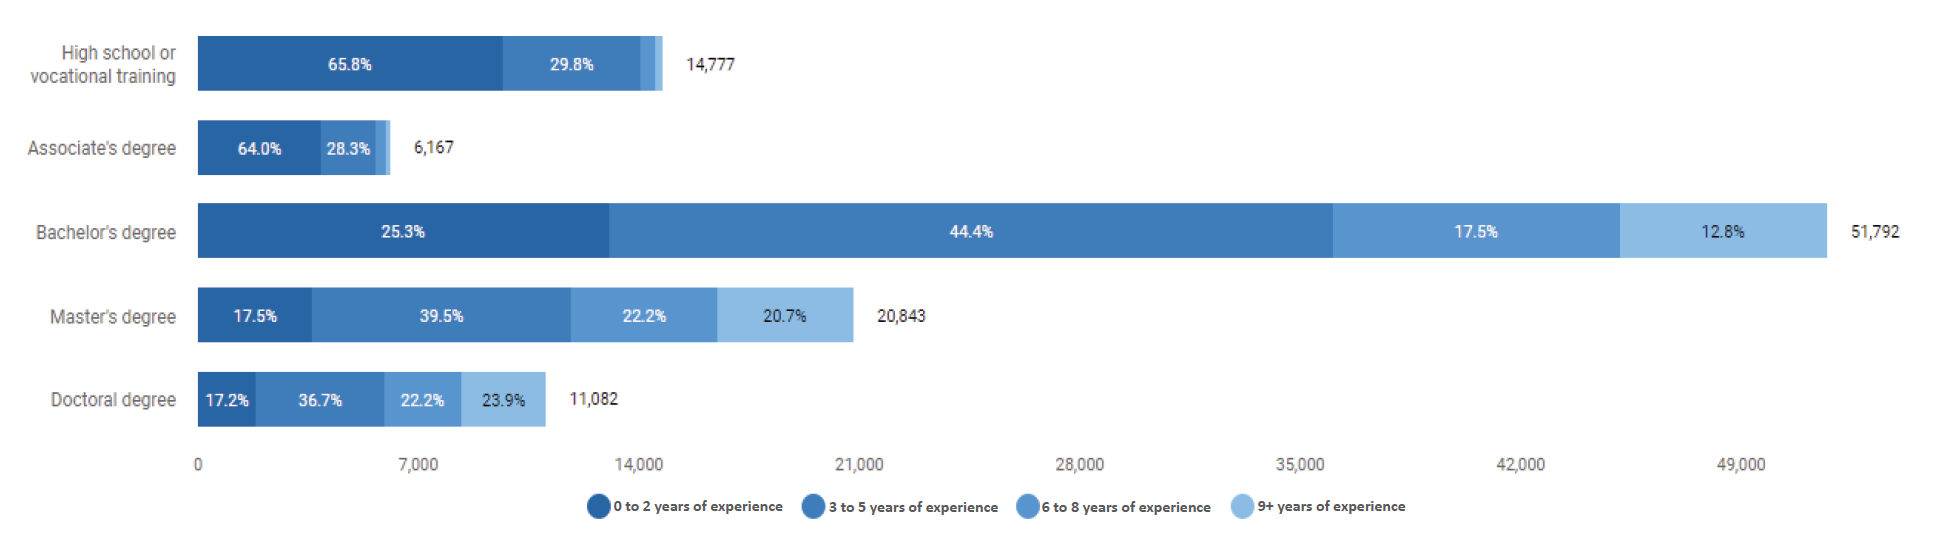
In San Mateo County, most jobs posted between November 1, 2020, and November 29, 2021, require a bachelor's degree or higher plus experience. Of the 173,636 total postings during this time frame, Burning Glass/Labor Insight report that 88% require at least a bachelor's degree.
Looking ahead, the California Employment Development Department projects that the occupations that will continue to grow the fastest in San Mateo County will primarily require at least a bachelor's degree, except for personal care aides9:
The role of the community colleges in the region could not be more important for the 47% of local high school students who enroll within one year of completing high school. Same for the many adults who move to the region to pursue economic opportunity, as well as the 24% who leave high school and do not enroll in college within the first 12-18 months of graduating.
The SMCCCD colleges are three of 25 public community colleges serving the region in the larger Bay Area. In 2019-20, the SMCCCD colleges served 35,668 students (8% of the Bay Area's 448,851 community college students) and conferred 3,078 degrees and certificates (6% of the 52,895 degrees awarded to all two-year Bay Area students).10
Regional Wages and the Cost of Attendance
Numerous studies of the factors that lead to persistence and completion of a students’ educational goals have found a close connection between the amount a student must work to live and their ability to persist and complete. “A 2016 study from the Urban Institute on minimum wage and higher education showed that a student working 800 hours a year in the 1960s and 1970s could afford to pay tuition, fees, and generally room and board at a four-year institution. Since 2002, students working 800 hours at minimum wage could only cover 57% of the average tuition and fees alone. By 2017, 800 hours of work at the minimum wage covered barely 28%.”11
These trends are even more pronounced in the San Mateo County Community College District due to the exorbitant cost of living and the relatively low wages paid by most occupations that do not require a two- or four-year degree or certificate. According to the MIT Living Wage Calculator, the minimum living wage for a single adult with no children in San Mateo County is $28/hour. That figure doubles to $56/hour with a child to support. While San Mateo raised its minimum wage to $15.62 as of January 2021, it does not come close to creating an economic environment in which a student can work part-time and afford to attend college at least part time.
The cost of tuition at the SMCCCD colleges was $1,439 for the 2020-21 academic year. Just a tiny fraction of that charged by the four California State Universities (CSU) serving the Bay Area ($7,427) or the two University of California (UC) undergraduate campuses ($14,100) and an even smaller portion when compared to the $34,000 tuition bill charged by many private colleges.
The relative cost advantage of attending a public, two-year college in the Silicon Valley region cannot be considered alone. The cost of living and supporting oneself (if not a family) while attending college is the critical factor and challenge for the SMCCCD colleges.
Regional Philanthropy as a Means to Offset Education Costs
Silicon Valley is home to nearly 1,000 active grant-making foundations with a total of $72 billion in total assets — approximately $4 billion or more of which is distributed on an annual basis. These foundations, plus corporate and individual philanthropists, continue to provide much-needed funding to the region’s nonprofit, community-based organizations.
Among the top 50 corporate philanthropists alone, $225 million was donated to local organizations in FY 2019-20, representing $43 million more than the prior year thanks to annual increases by Cisco (+$15.6 million), Google (+$6 million), and others.12 Sobrato Philanthropies topped the list of corporate donors for local giving during eight of the past nine years, with a total of half a billion dollars donated worldwide (75% locally) over that time. Corporate-advised grants through the Silicon Valley Community Foundation (SVCF) rose year-over-year as well, reaching $5.3 million to local Santa Clara and San Mateo County organizations (and another $11 million to others throughout the Bay Area) in 2020, responding to increased need during the pandemic.
Likewise, SVCF discretionary grant making to local nonprofits rose in 2020 to $6.3 million that year ($1.9 million more than in 2019). Donor-advised giving through SVCF represented a significant contribution (of $97 million) to address local needs, with the rest (94% of all donor-advised grants) directed to recipients elsewhere in the Bay Area or outside of the region. More than eight out of ten Silicon Valley individuals who itemize their taxes deducted some charitable contributions in 2019. In total, these contributions exceeded $5.28 billion in donations, although some may have been directed to donor-advised funds for disbursement in future years. These donations represented 19% of all charitable giving deducted on California (and 3% on all U.S.) individual tax returns that year. Philanthropy will be increasingly important in funding educational opportunities for our under-represented students. The top fifteen philanthropists present opportunities for CSM student scholarships.
Trends in K-12 Education
Enrollment trends in K-12 education in San Mateo County have declined by 6% over the past five years and are projected to continue declining by another 14% over the next 10 years, according to the California Department of Finance.13 These are established, statewide trends according to the Public Policy Institute for Higher Education.14 The impact of these declines on public, two-year college enrollments is less clear. Some California counties may see increases in enrollments while others may see overall decreases.
High School Graduations Rates
One of the factors influencing community college enrollments in the future is the percentage of high school students graduating. The California Department of Finance expects the total number of high school graduates statewide to peak in 2023-24 after which they expect them to decline through the end of the projection period (2030-31).
In San Mateo County, the California Department of Finance expects the number of high school graduates to decline from 6,592 in 2019-20 to 5,770 in 2030-31 (-12%). This trend mirrors the expected trend in K-12 enrollments.
College-Going Rates
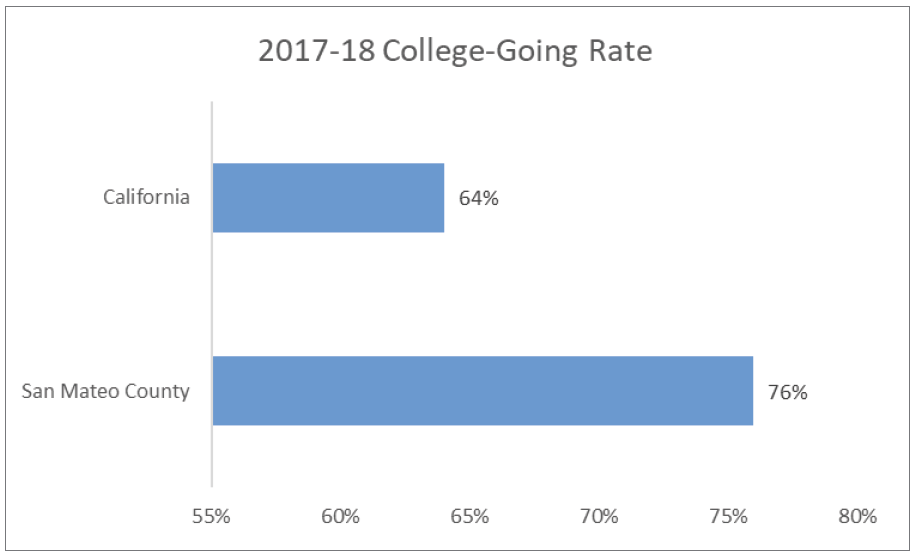
Of those students who complete high school in San Mateo County, many enroll in college within one year of completing high school. Overall, San Mateo County has the fourth-highest percentage of high school completers going to college in the State. Approximately 76% of County high school graduates attend college, nearly one-half of whom attend a community college.15 Combining the 47% of local high school completers who attend community college within one year of graduating high school and the 24% who do not attend any college within 12 or 16 months of completing high school, the local public community colleges are the best positioned to serve more than half of all high school completers in the County — approximately 3,600 students per year. As the K-12 population shrinks, however, this pool of potential SMCCCD students is likely to decrease.
According to the California Department of Education, the college-going trends by high school district in San Mateo County are as follows for 2017-18 (the most recent year for which data is available)16:
The college-going rate for San Mateo County high school completers varies widely by the race/ethnicity of the student. In San Mateo County in 2017-18, the gap between the college-going rate of Hispanic/Latinx and Asian students was 25 percentage points.17
Another factor influencing community college enrollments is the rate at which high school completers in the region complete the requirements for matriculating at the University of California (UC) and/or the California State University (CSU) systems. Critical to a high school graduate’s ability to attend a UC or CSU directly after high school is whether or not they have completed all of the prerequisites of direct matriculation — commonly referred to as “a-g” requirements due to the seven items on the list to meet minimum admission requirements for UC (CSUs are slightly different). To attend a UC after high school, students must complete 15-year-long high school courses with a letter grade of C or better—at least 11 of them prior to their last year of high school.18
While San Mateo County has an impressive overall “college-going rate” of 76%, not all of its high school graduates have completed the “a-g” requirements. When CSM’s feeder high schools are considered, the percentage of high school completers meeting UC/CSU requirements varies widely (data by high school coming).19
These trends are exacerbated when a student’s socio-economic status and/or race and ethnicity are considered. Data on a-g performance reveal the lowest rates among the African American and Hispanic populations, with improvements observed over time.
While the percentage of high school students in the Silicon Valley region meeting UC/CSU requirements improved for all groups over the last 9 years, equity gaps between student groups based on race and ethnicity persist. The gap between the share of African American and Asian high school graduates in Silicon Valley leaving high school ready to meet the requirements of the UC/CSU systems is still 40 percentage points. For Hispanic/Latinx students, the gap is even wider.
SMCCCD High School Take Rate
Before the COVID-19 pandemic, the San Mateo County Community Colleges experienced a 10-year decline of 19.8% in the number of County high school graduates enrolling at one of the three SMCCCD colleges, even as the total number of local high school graduates increased by 15.1% over the same period.
Changes in Higher Education
The COVID-19 pandemic has dramatically changed higher education. The National Student Clearinghouse reports declines in enrollment across segments, but two-year public colleges are particularly hard hit.20 Unlike other economic recessions, the pandemic recession saw steep declines in enrollments at the California Community Colleges. Many students who typically rely on community colleges have stopped out or never enrolled due to social, health and/or economic pressures and it is not clear when or how they will return.
The dramatic shift to online education brought on by the pandemic continues to be felt as colleges grapple with the best balance between in-person and online instruction and services. In California, the California Community College Chancellor’s Office (CCCO) has increased its commitment to the California Virtual Campus (CVC) as a way to improve more equitable access to online courses and degree and certificate programs across the State.21 There is renewed interest nationally in providing more degree programs 100% online. Private and public 4-year colleges (including the UCs and CSUs) are entering the market for 100% online programs. How will the community colleges create 100% online pathways to 100% online four-year programs?
These and other questions remain and need further exploration as the San Mateo County Community Colleges consider their external environment in their educational master planning processes.
End Notes
- Indicators of Higher Education Equity in the US 2021: Historical Trend Report. https://canadacollege.edu/emp/Indicators_of_Higher_Education_Equity_in_the_US_2021_Historical_Trend_Report.pdf
- https://www.bestplaces.net/cost_of_living/city/california/san_mateo. Bureau of Labor Statistics.
- Sources: https://patch.com/california/sanbruno/time-bomb-ticking-see-rental-arrears-san-mateo-
county; https://www.nytimes.com/2021/08/10/us/bay-area-hunger-problem.html - Ron Hetrick et al., The Demographic Drought (Moscow, ID: Emsi, 2021), eBook https://www.economicmodeling.com/demographic-drought/
- America’s Labor Market Information System (ALMIS) Employer Database, 2021, 1st Edition. https://www.labormarketinfo.edd.ca.gov/majorer/countymajorer.asp?CountyCode=000081
- Bureau of Labor Statistics: https://www.bls.gov/eag/eag.ca_sanfrancisco_md.htm
- Source: Burning Glass/Labor Insight/EMSI
- Source: Burning Glass/Labor Insight/EMSI9
- The San Francisco-Redwood City-South San Francisco Metropolitan District according
the the California
Employment Development Department. - California Community College Chancellor’s Office Data Mart: Outcomes.
https://datamart.cccco.edu/
Outcomes/Program_Awards.aspx - https://www.diverseeducation.com/institutions/community-colleges/article/15113866/community-
college-students-persistence-and-the-minimum-wage - Ron Hetrick et al., The Demographic Drought (Moscow, ID: Emsi, 2021), eBook https://www.economic
modeling.com/demographic-drought/ - California Department of Education (https://dq.cde.ca.gov/dataquest/dqcensus/EnrGrdYears.aspx?cds=
41&agglevel=county&year=2020-21) and California Department of Finance (https://www.dof.ca.gov/
Forecasting/Demographics/Projections/Public_K-12_Graded_Enrollment/) - Public Policy Institute of California, https://www.ppic.org/publication/declining-enrollment-in-california-schools-fiscal-challenges-and-opportunities-in-the-coming-decade/