See our SEDs poster presented at January 2011 AAS meeting in Seattle here.
Welcome to our Spectral Energy Distributions (SEDs) page with educational tools including templates and instructions for investigating SEDs. This project is made possible through NASA/IPAC Teacher Archive Research Project (NITARP) here.


Project coordinator Sally Seebode CSM Prof. Darryl Stanford / Dr. Steve Howell NOAO
What are SEDs?
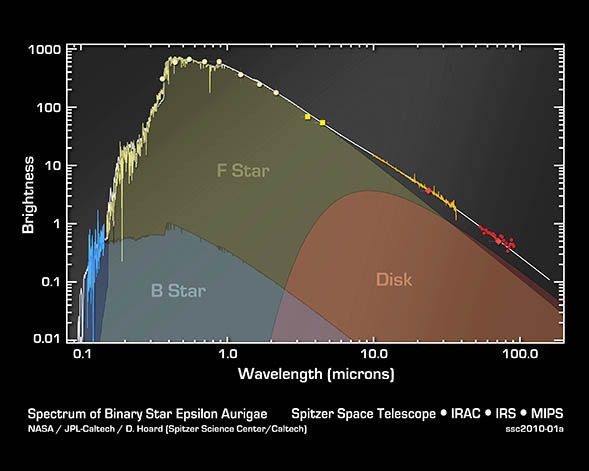
A spectral energy distribution is a graph of the energy emitted by a star as a function of wavelength. An SED resembles a blackbody curve, and can be composed of spectra or photometric data observations of a star.
Why SEDs?
Key items used in studying stars are spectral type, temperature, radius and distance. These terms may be defined for students, but understanding how astronomers use data to determine these items is not as obvious. This page will help students understand, determine, and learn how to apply information about spectral type, temperature, radius and distance to answer deeper questions, such as cluster membership.
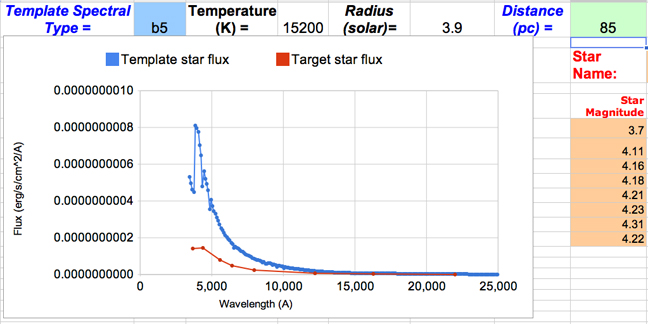
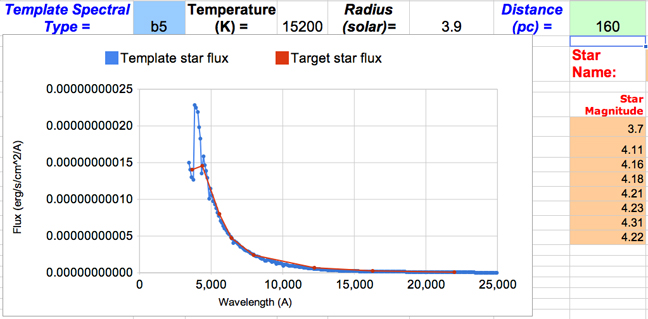
SEDs tool samples...

SEDs part 2 poor match: 85 pc

SEDs part 2 good match: 160 pc
Where to Start
On this page we present instructions and templates for using SEDs in the classroom. Teachers can customize instructions and procedures for their individual class level.
SEDs Part 1 here. Part 1 College instructions here. Part 1 High school instructions here.
SEDs Part 2 here. Part 2 College instructions here. Part 2 High school instructions here.

SED of Epsilon Aurigae -Dr. D.W. Hoard, Cal Tech
SEDs project developed by the following:
Sally Seebode, Project Coordinator
San Mateo High School, San Mateo, CA
seebode.sally@gmail.com
Professor Darryl Stanford
College of San Mateo, San Mateo, CA
stanfordd@smccd.edu
Dr. Steve Howell
NOAO, Tucson, AZ
howell@noao.edu
Dr. D.W. Hoard
Spitzer Science Center, Pasadena CA
dwhoard@gmail.com
Dean Drumheller
College of San Mateo, San Mateo, CA
drumhellerd@smccd.edu